Posts Tagged ‘Click-Through Rates’
Social Video Ad CTRs By Generation [CHART]
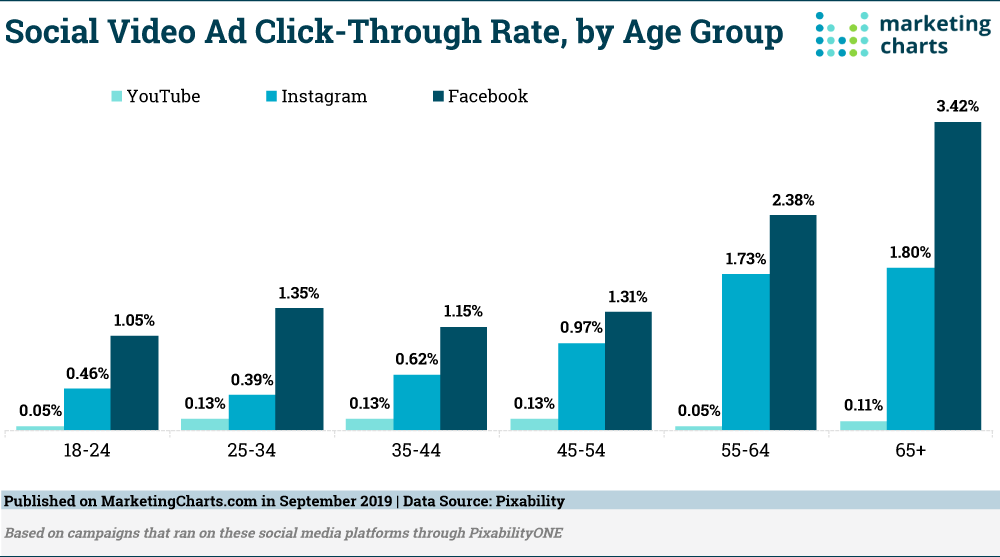
Video accounts for a large portion of the advertising spend of major national advertisers, with marketers contending that video has higher conversion rates than other content.
Read MoreEmail Personalization [INFOGRAPHIC]
This infographic from Active Trail illustrates 13 email personalization statistics to help make your case.
Read MoreCTR By Length Of Brand Content Headline [CHART]
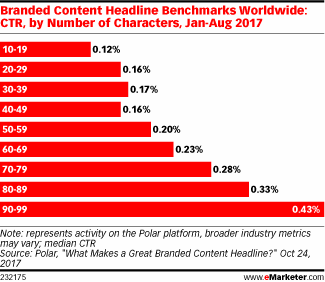
Branded content headlines between 90 and 99 characters achieved a clickthrough rate (CTR) of 0.43%, higher than headlines with fewer characters.
Read MoreGoogle Ranking Factors For Desktop Search [CHART]
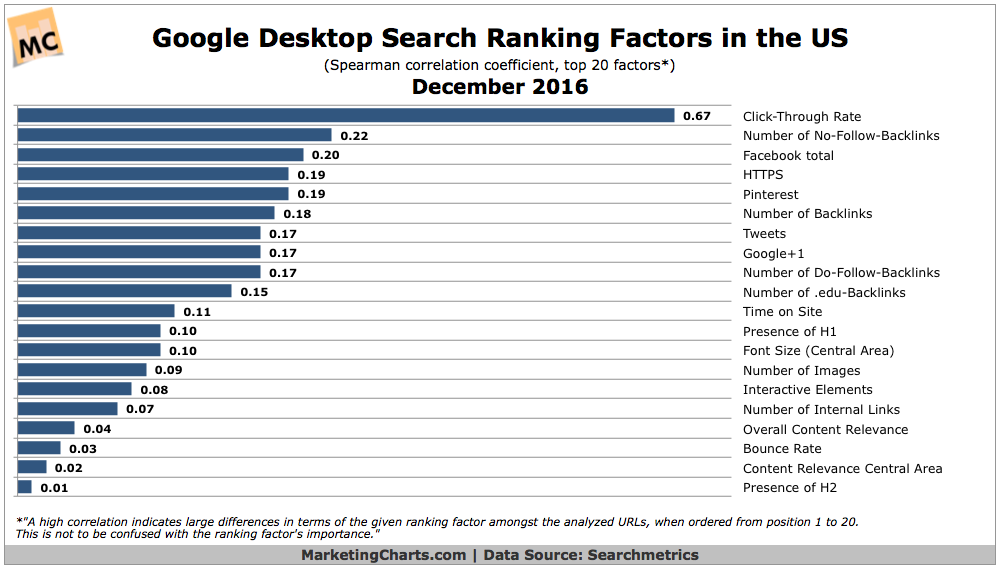
Google search ranking factors no longer apply universally but must be analyzed on an industry-specific basis.
Read MoreVideo Marketing Statistics [INFOGRAPHIC]
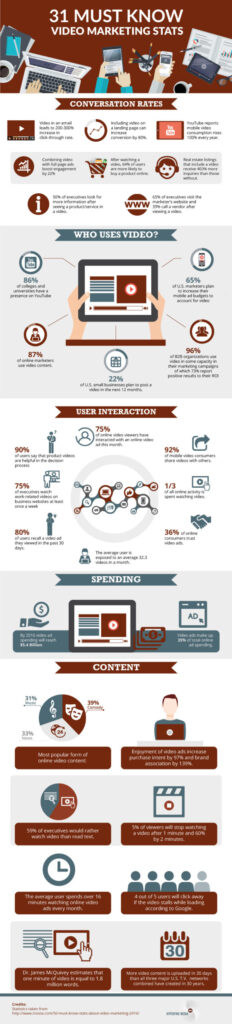
Including a video in an email increases the click-through rate by 200-300 percent. This statistic and 30 more are included in this infographic from Hyperfine Media that illustrates the many ways video can be used for marketing.
Read MoreGoogle AdWords Benchmark Metrics By Industry [CHART]
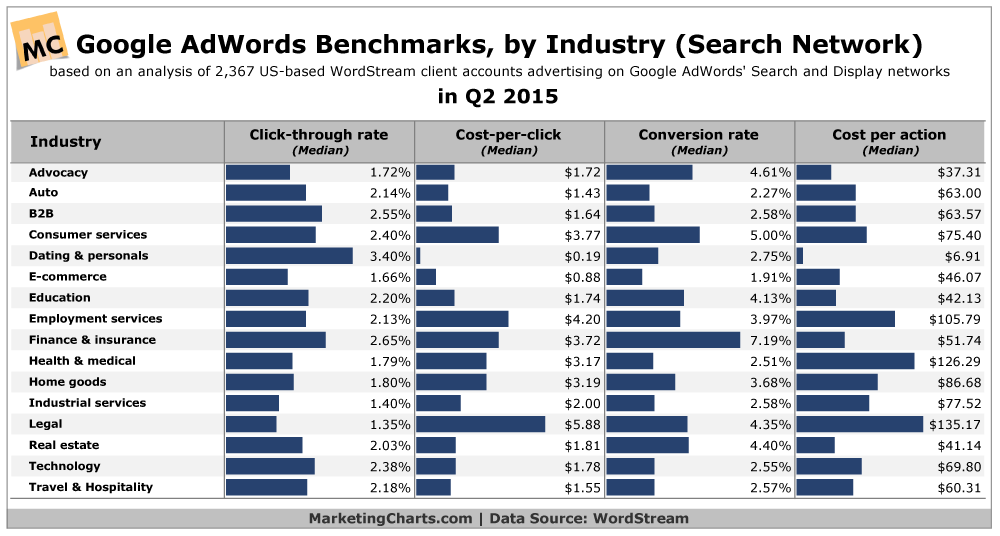
The median click-through rate (CTR) in AdWords across industries is 1.91% on the search network.
Read MoreElements Of Successful Email Campaigns [INFOGRAPHIC]
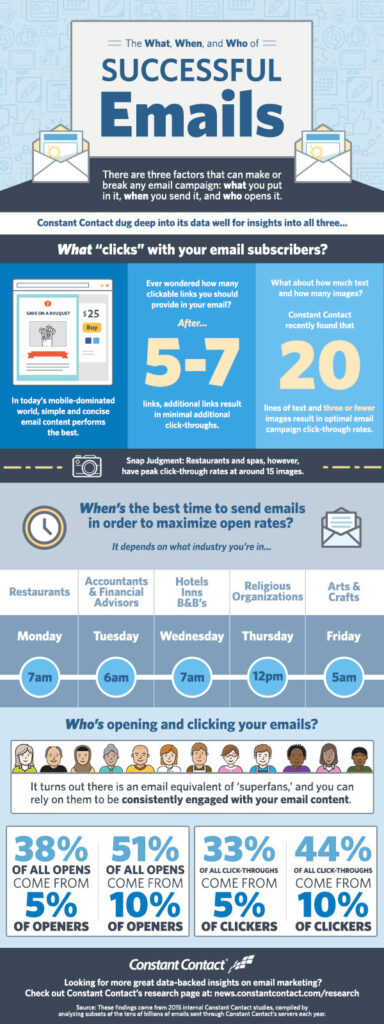
This infographic highlights research from email marketing service provider Constant Contact illustrating the elements of successful email campaigns.
Read MoreFacebook Exchange CTRs vs Facebook Custom Audiences CTRs, January-December 2014 [CHART]
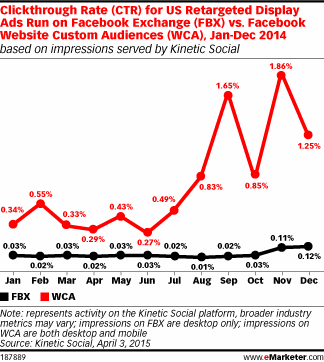
In December 2014, the average CTR for US retargeted display ads run on WCA was 1.25%, vs. just 0.12% for FBX.
Read MoreSocial Video Advertising Metrics, April 2015 [CHART]
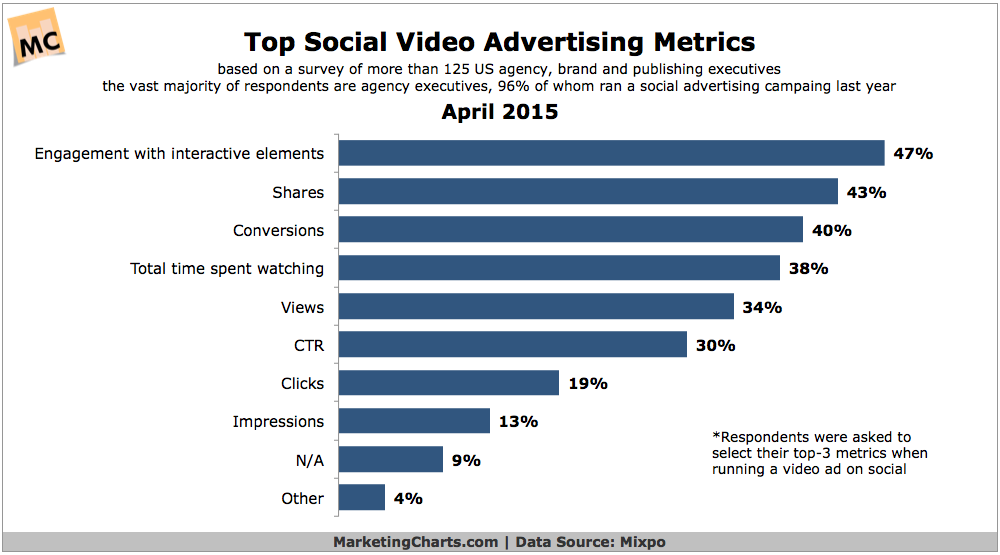
Advertisers running video ads on social media are more interested in metrics such as engagement with interactive elements and shares than they are with views.
Read MoreEmail CTO Rates, Q4 2014 [CHART]
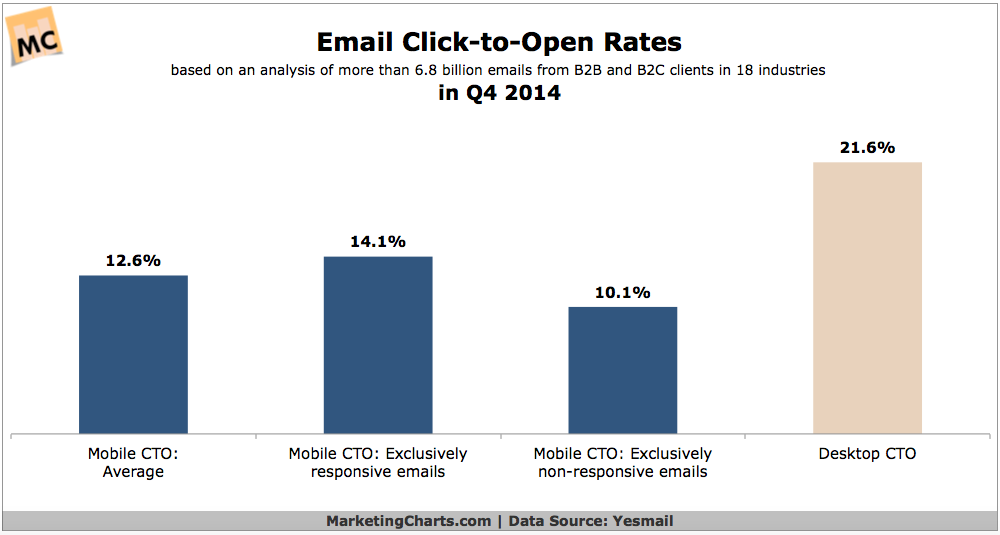
Email CTO Rates: Mobile email clicks accounted for almost 40% of all email clicks in Q4 2014.
Read More