Posts Tagged ‘Cable Television’
SMB Local Advertising Spending By Medium, 2012 vs 2013 [CHART]
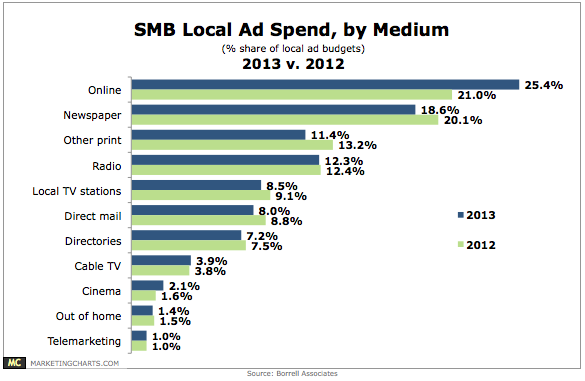
SMBs will devote 26.6% of their local ad budgets to newspapers (18.6%) and other print media (8%) this year.
Read MoreSMB Media Ad Buys, January 2013 [CHART]
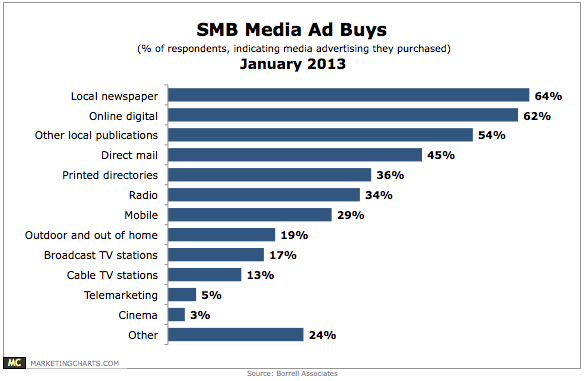
Newspaper ad expenditures have been on a steady decline for several quarters now, but SMBs still see the local paper as a valuable advertising medium.
Read MoreCollege Student Access To Select Media By Channel, January 2013 [CHART]
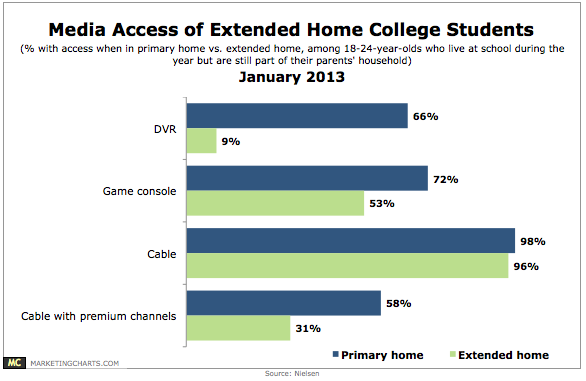
The 18-24 demographic is watching slightly less TV these days, and concurrently watching more internet and mobile video.
Read MoreGlobal Cable TV Revenue Share, 2012 & 2013 [CHART]
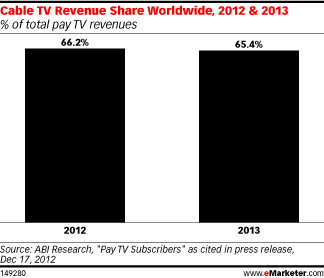
A proliferation of IPTV (internet protocol television) options, and strong growth in the subscriber base, means that cable’s share of the total worldwide pay TV market will actually decline slightly in 2013.
Read MoreGlobal Pay TV Subscribers, 2012 & 2013 [CHART]
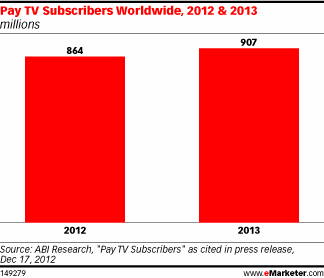
An additional 47 million people worldwide signed up for a pay TV package in 2012, bringing the total number of global subscribers to 864 million.
Read MoreBudget Cuts To Fund Digital Video [CHART]

Fully 97% of more than 700 surveyed professionals from across the digital media industry report that their digital video ad spending is up this year.
Read MoreDigital Politics [INFOGRAPHIC]
This infographic from Pew Internet & American Life summarizes their research on the use of the Internet for politics.
Read MoreMethods Used To Watch TV Content, June 2012 [CHART]
30% of all US internet users used a gaming console to watch online video.
Read MoreHow Internet Users Watch TV Content, June 2012 [TABLE]
29% of US internet users have watched TV content through a mobile device.
Read MoreTraditional Television Viewership By Generation, Q1 2011- Q2 2012 [CHART]

The 18-24 group, for instance, watched a weekly average of 22 hours and 32 minutes of traditional TV in Q2, about 1 hour and 45 minutes less than they did in Q2 2011.
Read More