Posts Tagged ‘Branded Content’
Content Marketing Statistics [INFOGRAPHIC]
This infographic from Review 42 illustrates 47 sets of statistics to inform your content marketing efforts.
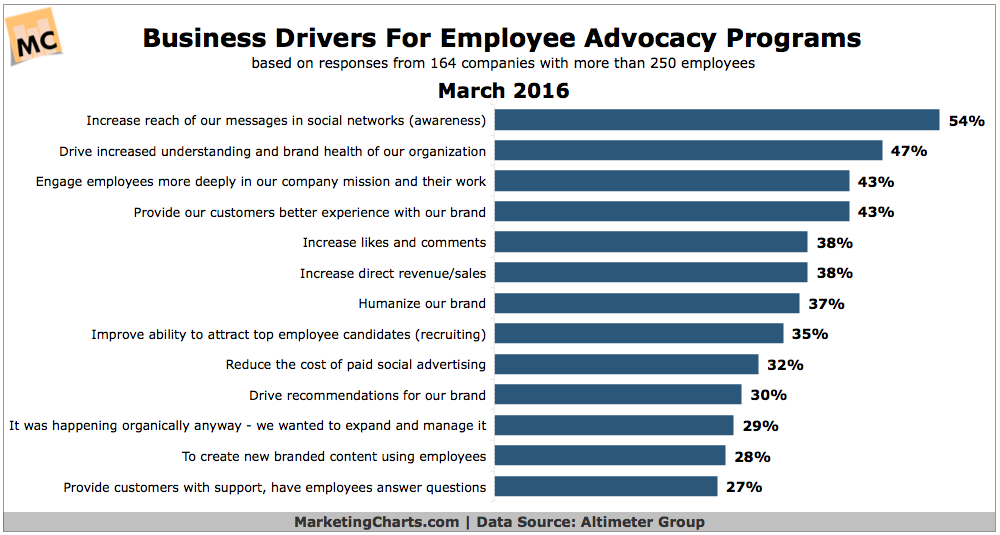
Read MoreTop Purposes Of Employee Advocacy Programs [CHART]
Employee advocacy is one of the fastest growing social business programs, per a report from the Altimeter Group.
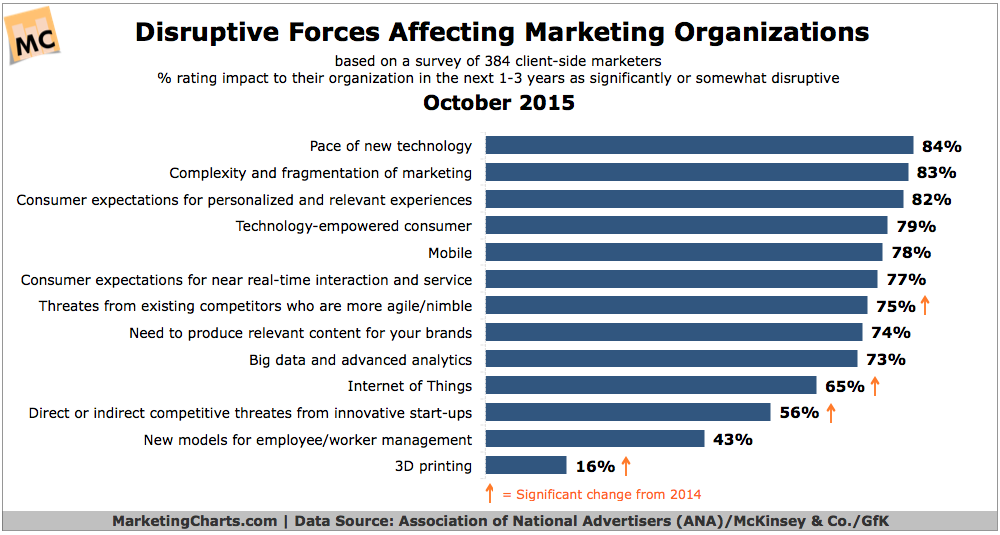
Read MoreTop Forces Disrupting The Marketing Industry, October 2015 [CHART]
Topping the list, as it did in last year’s report, was the pace of new technology, cited as being significantly or somewhat disruptive by 84% of respondents.
Read MoreCreating Shareable Content [INFOGRAPHIC]
This infographic from Insights In Marketing illustrates 7 steps for creating trustworthy, shareable content.
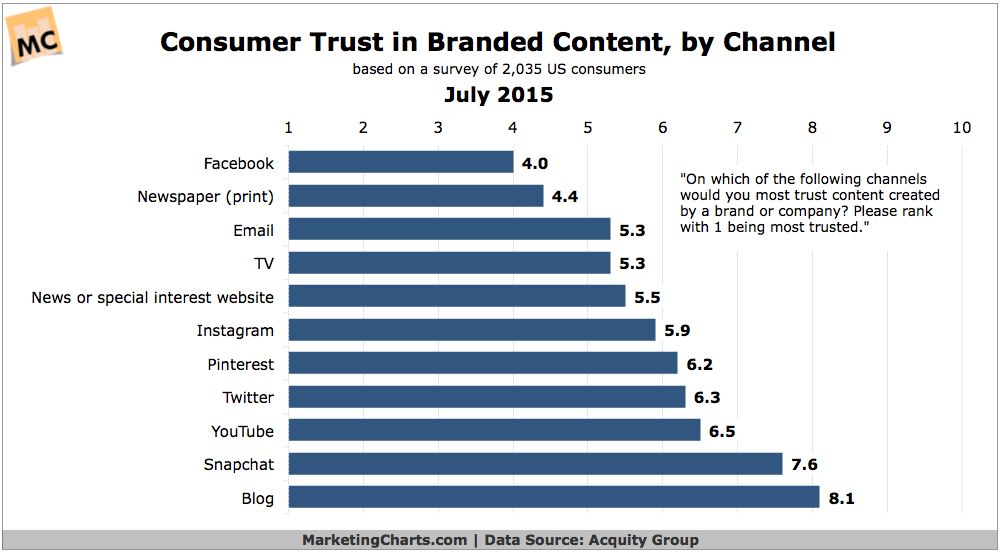
Read MoreTrust In Branded Content By Channel, July 2015 [CHART]
Consumers are more likely to trust brand content found in a print newspaper and on TV than in a variety of social platforms.
Read MoreSpending On Branded Mobile Content, Q1 2014 [CHART]
Still relatively new, branded editorial media on mobile devices is luring consumers in.
Read MoreNetflix Branded Content Examples & Wikipedia's Battle Against Brands [VIDEO]
Episode 53 of the Beyond Social Media show: David Erickson & BL Ochman discuss examples of Netflix branded content efforts & Wikipedia’s battle with brands.
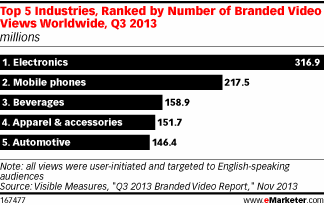
Read MoreTop 5 Industries By Number Of Branded Video Views, Q3 2013 [CHART]
The top industry for such views was electronics, which ranked far ahead of runner-up mobile phones.
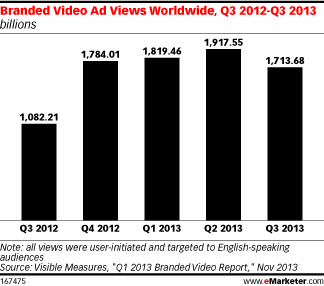
Read MoreGlobal Branded Video Views, Q3 2012-Q3 2013 [CHART]
Branded videos skyrocketed in viewership worldwide between the end of 2012 and 2013.
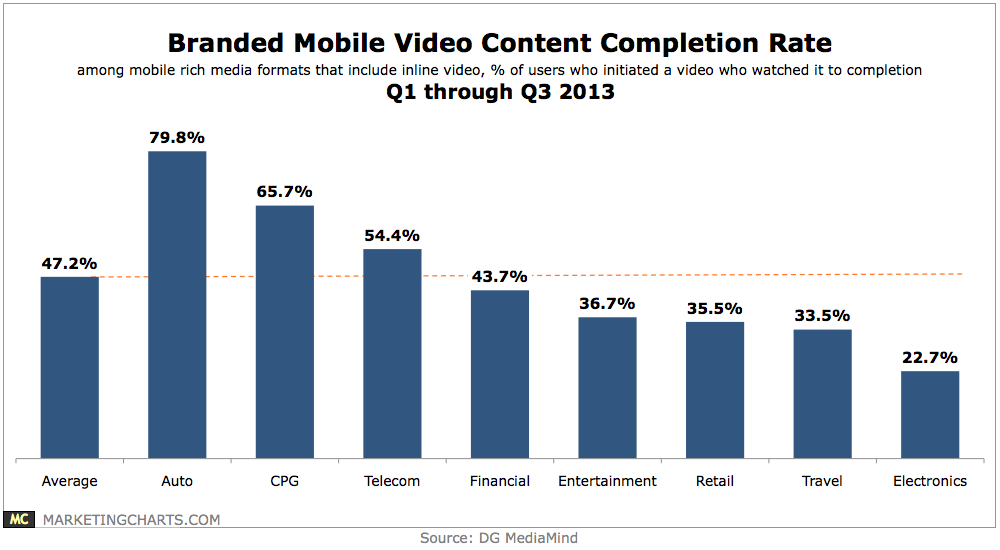
Read MoreBranded Mobile Video Content Completion Rates, Q1 – Q3 2013 [CHART]
47.2% of branded videos initiated by users were watched to completion, with that figure highest for auto (79.8%), CPG (65.7%) and telecom (54.4%) advertisers.
Read More
