Posts Tagged ‘Blackberry’
Mobile Operating System Market Share, 2011 vs 2012 [CHART]
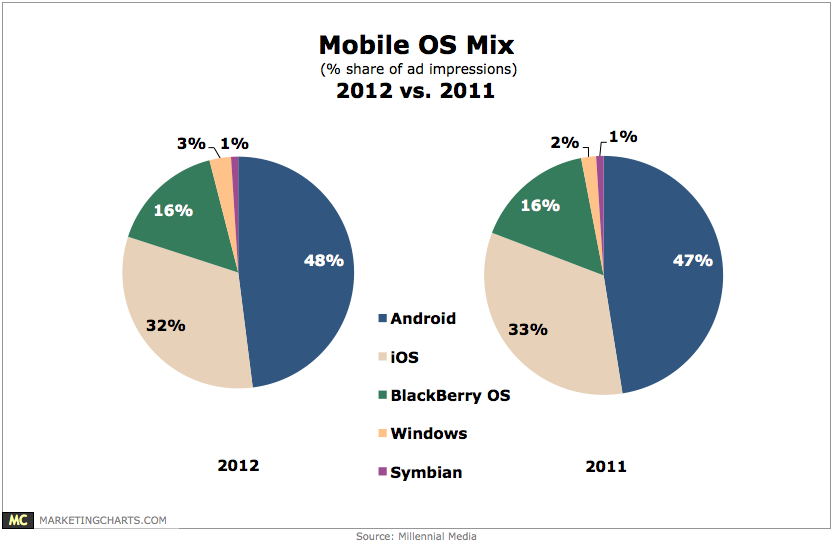
With 75% share of total ad impressions, the smart phone share grew by 7% points from 2011.
Read MoreBeyond Social Media: Burger King Hacked, Maker's Mark Social Slapped & LinkedIn's Claps [PODCAST]

This week’s highlights include the Twitter hacks of Burger King & Jeep, Maker’s Mark does and about face, LinkedIn appeals to vanity, a Alicia Keys’ iPhone Tweet, Shiny New Stuff and much more.
Read MoreSocial Super Bowl XLVII [INFOGRAPHIC]
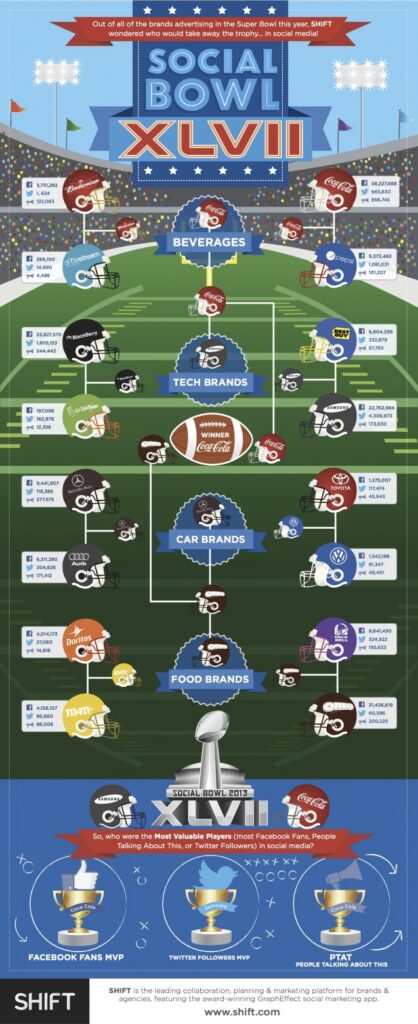
This infographic pits some major brands that advertised during Super Bowl XLVII against one another based on social media presence.
Read MoreMobile OS Market Share, Q3 2012 [CHART]

64% of mobile game impressions came from devices running the Android OS in Q3, while 30% came from iOS.
Read MoreNorth American Publishers' Mobile Apps By Device, 2011 & 2012 [CHART]
The iPhone and iPad were the No. 1 devices for which publishers developed mobile apps. Mobile apps are important to media companies across all devices, however.
Read MoreNorth American Publishers That Charge For Mobile Content By Device, October 2012 [CHART]
The iPad saw the greatest percentage of publishers charging for content across publication categories.
Read MoreUS Smart Phone Users By Generation & Manufacturer, May 2012 [CHART]
Millennials are the only generation more likely to own an iPhone than any other handset; in all other age categories, Samsung either led or tied with Apple.
Read MoreMobile Platform Development Preferences, Q4 2012 [CHART]
About 63% of mobile developers are very interested in using HTML5 to build their apps.
Read MoreSmart Phone Ownership By Generation [INFOGRAPHIC]
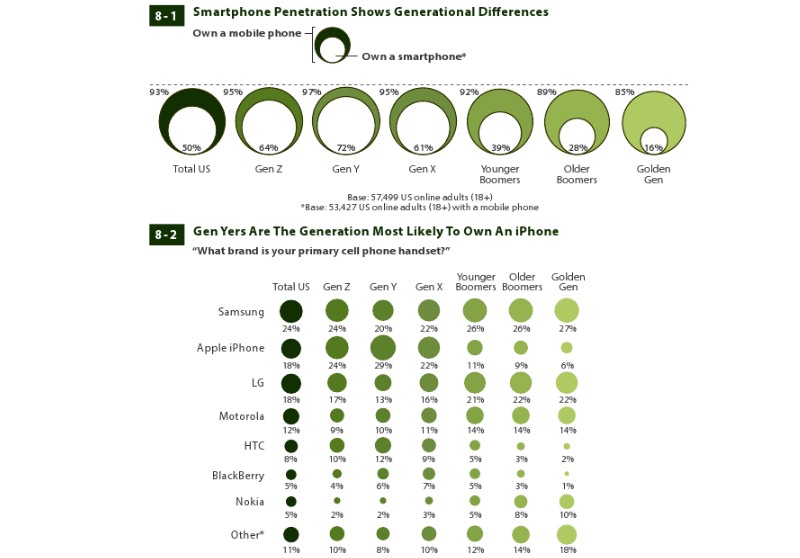
Gen Y is the most likely to own an iPhone. About 29% of the generation say they own one of Apple’s popular smart phones.
Read MoreGlobal Smart Phone Shipments By OS, Q2 2011 & Q2 2012 [TABLE]
Symbian shipped 18 million smart phones in the second quarter of 2011. But one year later, that number had dropped to 6.8 million.
Read More