Posts Tagged ‘Bing’
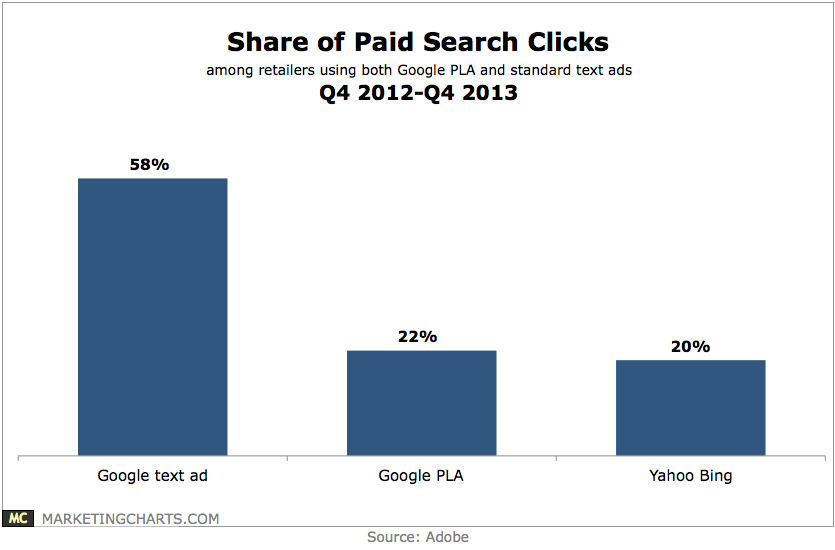
Share Of Search Ad Clicks, Q4 2012 – Q4 2013 [CHART]
Cost-per-click for Google product listing ads (PLAs) jumped by 80% year-over-year during Q4 2013, all the while maintaining a relatively steady ROI.
Read MoreSocial Search [INFOGRAPHIC]
This infographic by Prestige Marketing illustrates some trends in social search.
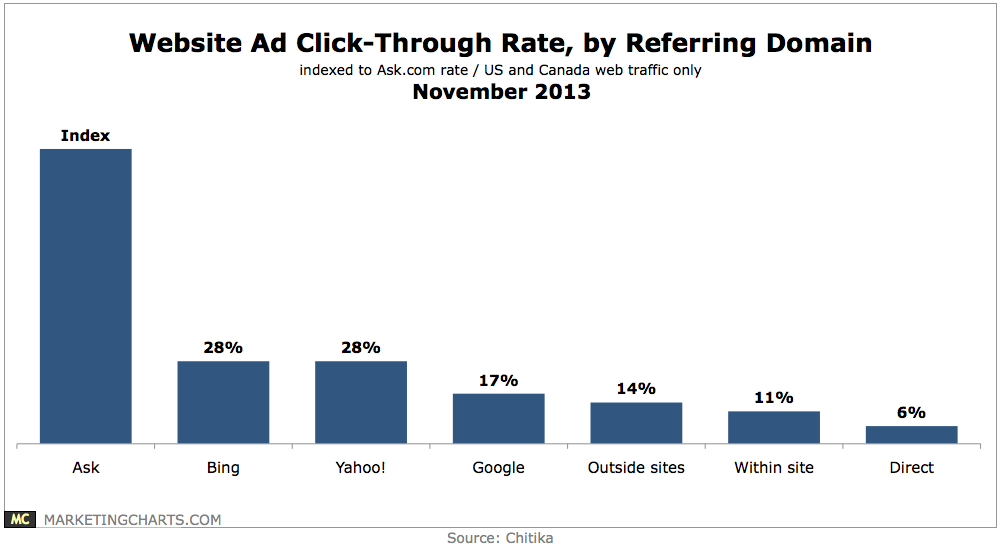
Read MoreWebsite Ad CTR By Referring Domain, November 2013 [CHART]
Website traffic that is referred by search engines tends to have a higher ad click-through rate than traffic that comes from other sources.
Read MoreGlobal Search Engine Market Share, Q2 2013 [CHART]
Chinese search engine Baidu’s share of global paid search clicks continues to grow.
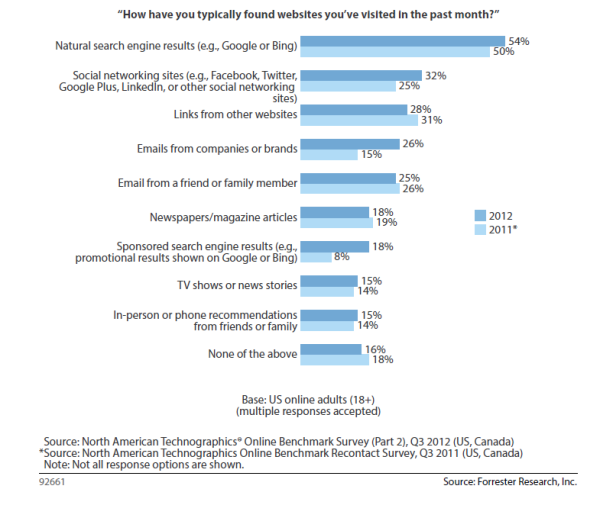
Read MoreHow People Find Websites, 2011 vs. 2012 [CHART]
54% of respondents found websites through natural search results in 2012, up from 50% in 2011.
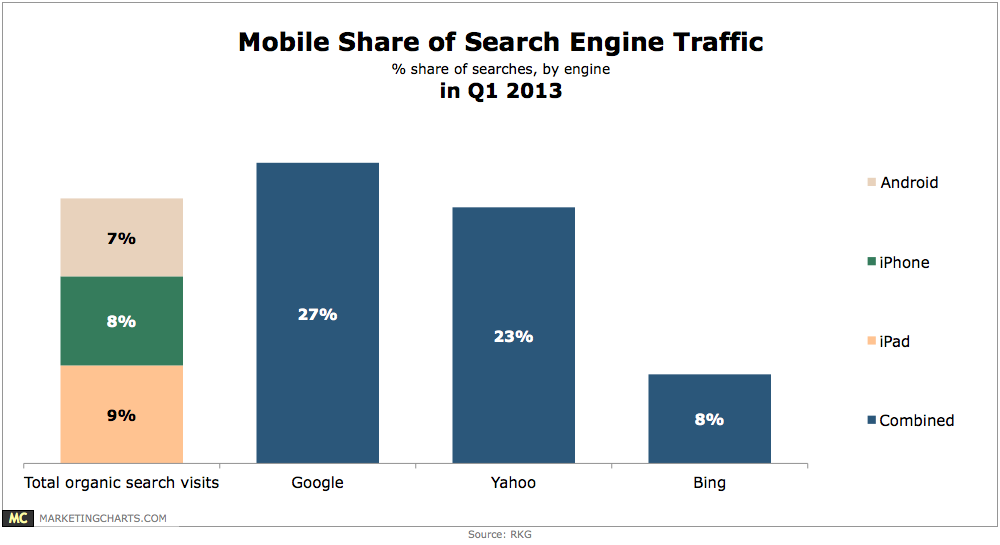
Read MoreMobile Share Of Search Traffic, Q1 2013 [CHART]
Tablets and smart phones combined accounted for roughly 24% of organic search visits in Q1.
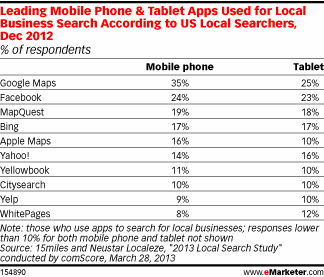
Read MoreTop Mobile Apps Used For Local Business Search, December 2012 [TABLE]
Google Maps was the No. 1 app used for local searches on phones and tablets, at 35% and 25%, respectively.
Read MoreUS Search Ad Revenue Market Share, 2011-2015 [TABLE]
Google’s share of net US search ad revenues is expected to reach 73.7% this year, up from 72.8% in 2012.
Read MoreWebsite Homepage Information Small Businesses Lack, June 2012 & February 2013 [CHART]
More than 60% of small businesses lacked an address on their homepage, and nearly 50% did not provide a contact number.
Read MoreSearch Ad Spending Share By Device & Search Engine, Q4 2011 – Q4 2012 [TABLE]
On desktops, Google captured more than four-fifths of search spending in the last quarter measured.
Read More