Posts Tagged ‘Beverage Marketing’
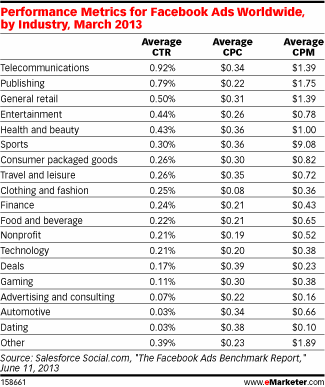
Global Facebook Advertising Performance Metrics By Industry, March 2013 [TABLE]
For overall Facebook ads served by industry, sports cost by far and away the most, at a CPM of $9.08.
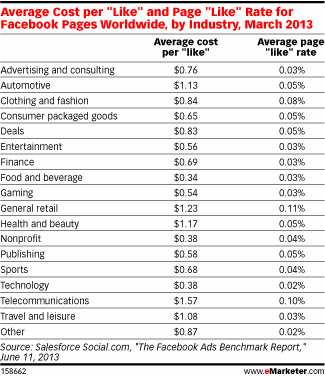
Read MoreGlobal Facebook Cost Per Like By Industry, March 2013 [TABLE]
General retail and telecommunications had the most success generating page “likes,” at a rate of 0.11% and 0.10%, respectively.
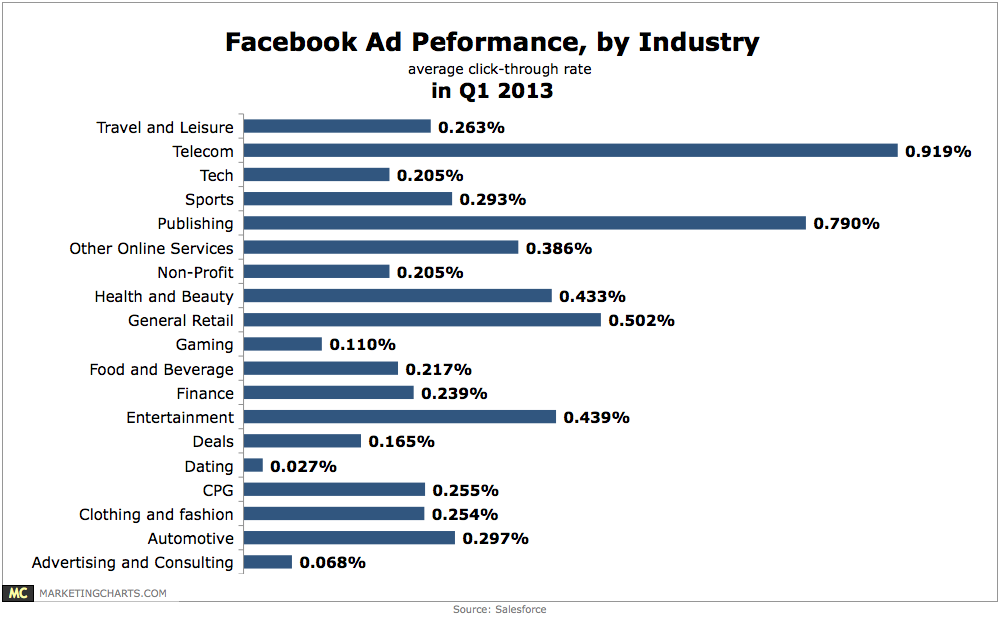
Read MoreFacebook Ad Performance By Industry, Q1 2013 [CHART]
Telecom (0.919%) and publishing (0.79%) brands are leading the charge in click-through rates.
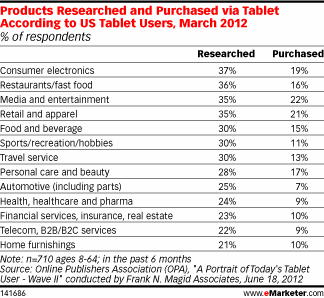
Read MoreProducts Researched & Purchased On A Tablet, March 2012 [TABLE]
A survey from the Online Publishers Association compared product research with product purchase by category among tablet users in March 2013.
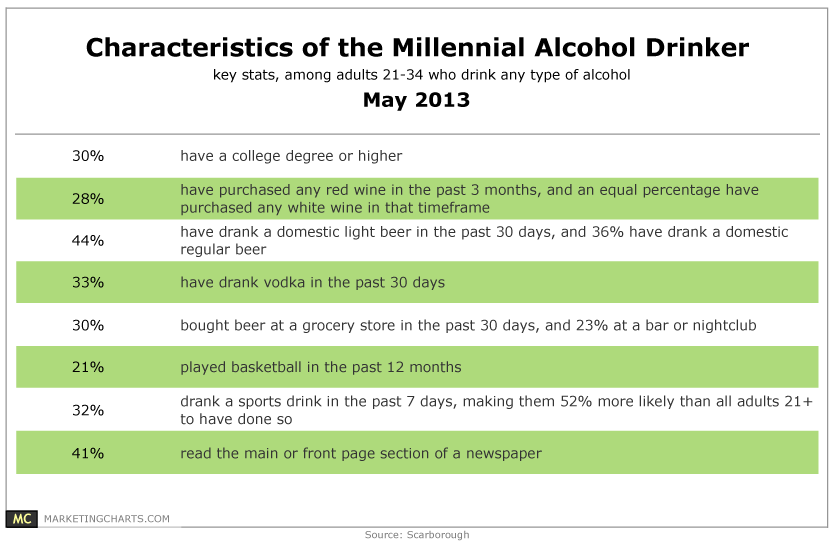
Read MoreCharacteristics Of Millennials Alcohol Drinkers, May 2013 [TABLE]
71% of American adults aged 21 and older drink some type of alcohol, whether that be beer, hard cider, liquor, wine, or wine coolers, and Millennials (21-34) make up 27% of that group.
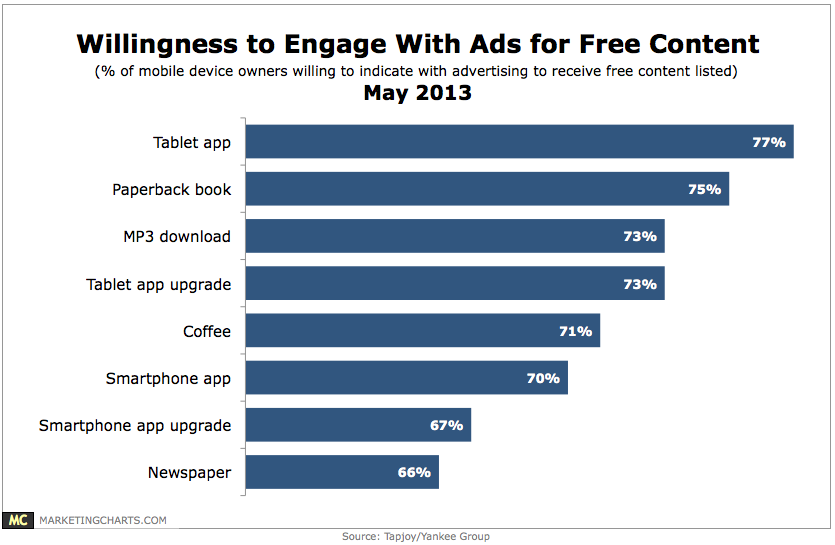
Read MoreAccepting Advertising For Free Content, May 2013 [CHART]
Mobile device owners would prefer to spend time engaging with advertising in order to receive free content, whether that be a tablet (77%) or smartphone (70%) application, or even a newspaper (66%).
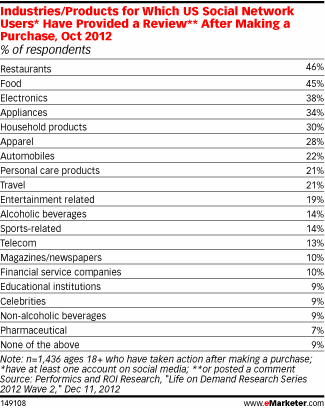
Read MoreIndustries & Products For Which People Have Written Post-Purchase Online Reviews, October 2012 [TABLE]
Among social network users who took a post-purchase action online, 22% reported posting a review or other comment after an automobile purchase.
Read MoreAmerican Retail eCommerce Sales CAGR By Category, 2012-2017 [CHART]
A mix of larger and smaller online product categories will post the highest CAGRs from 2012 to 2017.
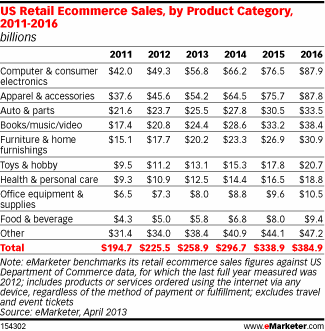
Read MoreAmerican Retail eCommerce Sales By Product Category, 2011-2016 [TABLE]
Computer and consumer electronics, as well as apparel and accessories, account for the bulk of US retail eCommerce sales.
Read More