Posts Tagged ‘Benchmarks’
Facebook Advertising Benchmarks, Q2 2013 vs Q2 2014 [CHART]
The average click-through rate for Facebook ads on desktop and mobile platforms in Q2 was 0.36%.
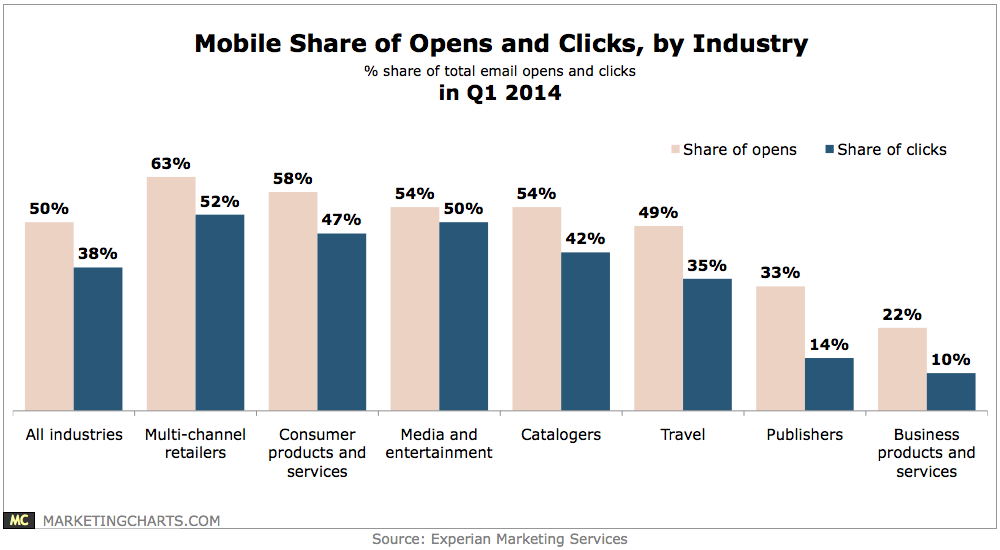
Read MoreMobile Email Benchmarks By Industry, Q1 2014 [CHART]
Half of total email opens occurred on a mobile device in Q1 2014.
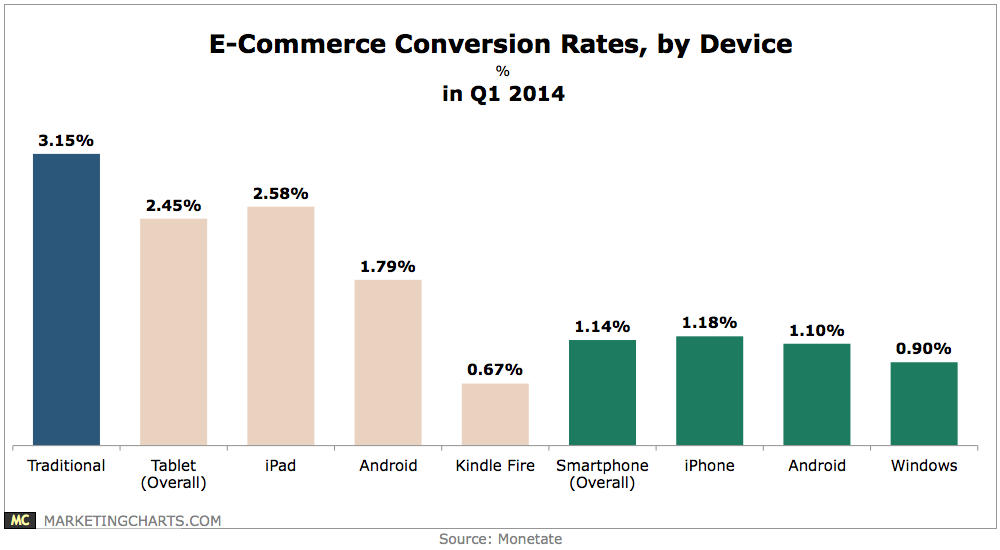
Read MoreE-Commerce Conversion Rates By Device, Q1 2014 [CHART]
Tablet (2.45%) and smartphone (1.14%) conversion rates trailed traditional computers (3.15%) again in Q1.
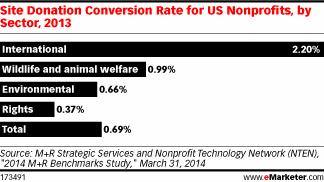
Read MoreUS Nonprofit Site Donation Conversion Rates By Sector, 2013 [CHART]
16% increase in monthly site traffic for the US nonprofits studied led to a site donation conversion rate of 0.69%, upping the average visit value to 60 cents.
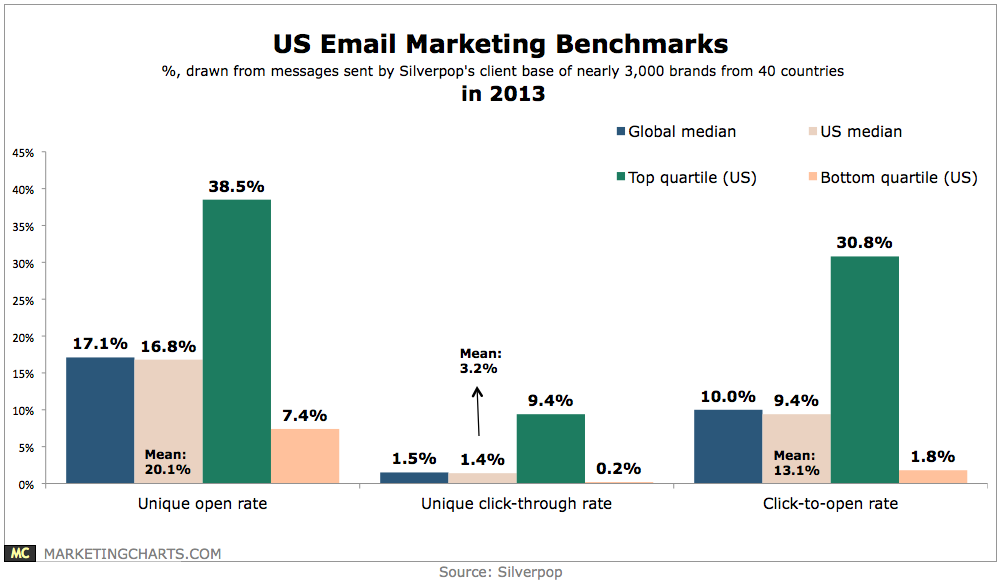
Read MoreUS Email Marketing Benchmarks, 2013 [CHART]
The mean unique open rate for US email marketers last year was 20.2% and the median rate 17.1%.
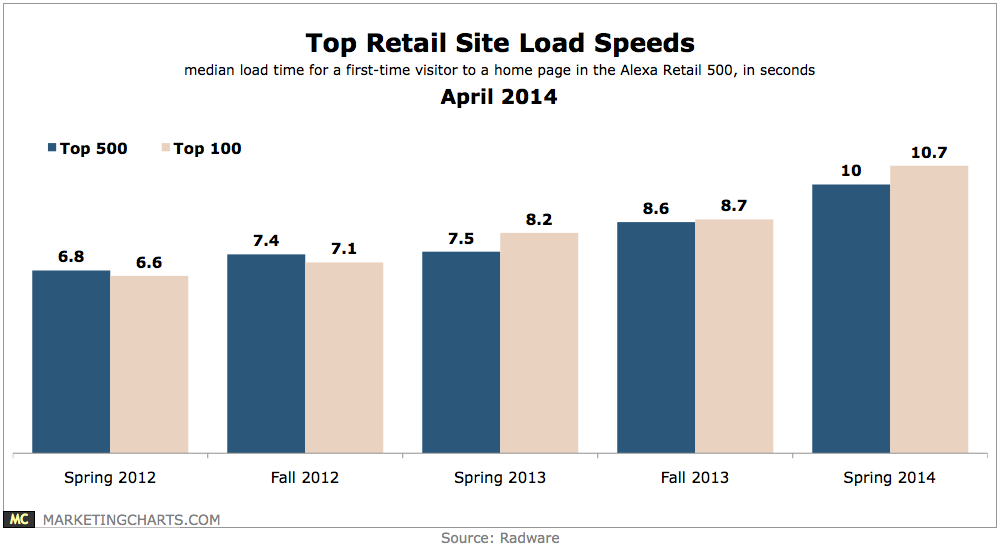
Read MoreTop Retail Site Load Speeds, April 2014 [CHART]
The median load time for home pages of the top 500 US retail websites continues to slow down, clocking in at 10 seconds.
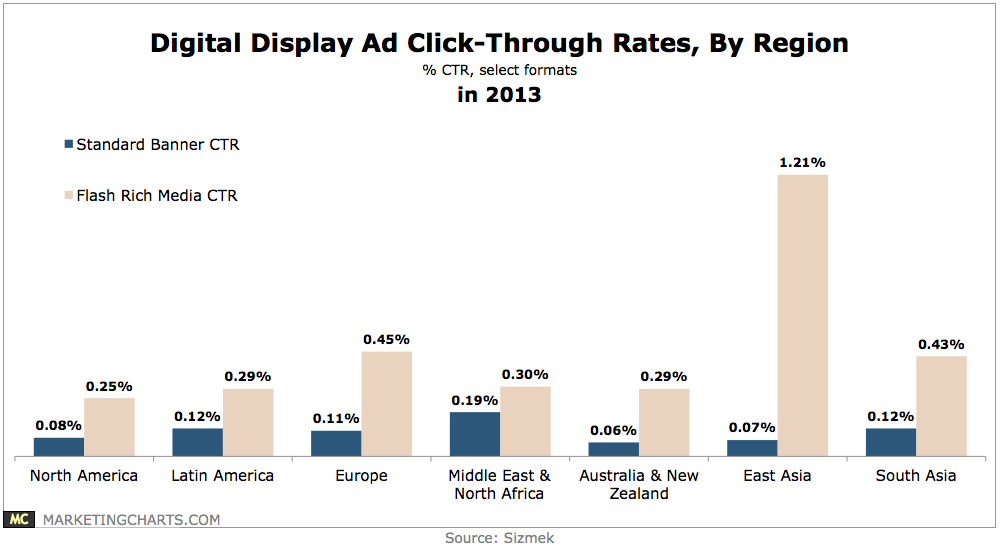
Read MoreOnline Display Ad Benchmarks By Region in 2013 [CHART]
In North America, the average click-through rate (CTR) for standard banners slipped from 0.1% to 0.08%, while flash rich media CTRs jumped from 0.14% to 0.25%.
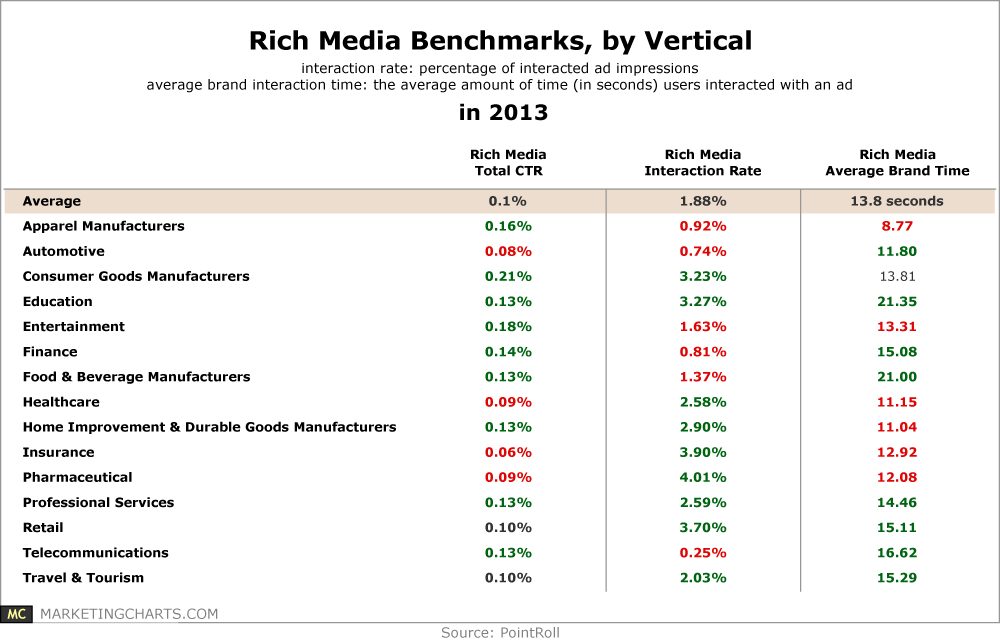
Read MoreRich Media Ad Benchmarks By Vertical, 2013 [TABLE]
Rich media click-through and interaction rates were higher when including video.
Read MoreUS Paid Search Benchmarks By Device, 2013 [CHART]
Click-through rates across devices much more similar when normalizing for ad position, at least for positions 1 through 5. Marin’s study also predicts that by the end of next year, mobile could account for half of all paid search clicks.
Read MoreFrequency Of Email Testing [CHART]
64% of B2C organizations routinely track tests through the entire funnel.
Read More