Posts Tagged ‘Benchmarks’
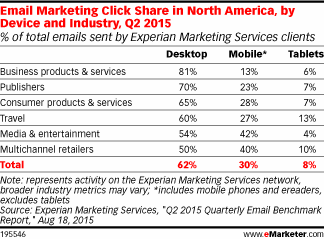
Marketing Email Click Share By Industry, Q2 2015 [TABLE]
On average, 62% of clicks happened on the desktop—14 percentage points ahead of the desktop share of opens.
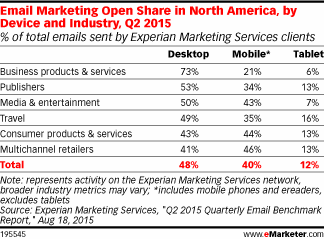
Read MoreMarketing Email Open Share By Industry, Q2 2015 [TABLE]
Overall, 48% of all marketing emails sent by Experian clients were opened on the desktop,
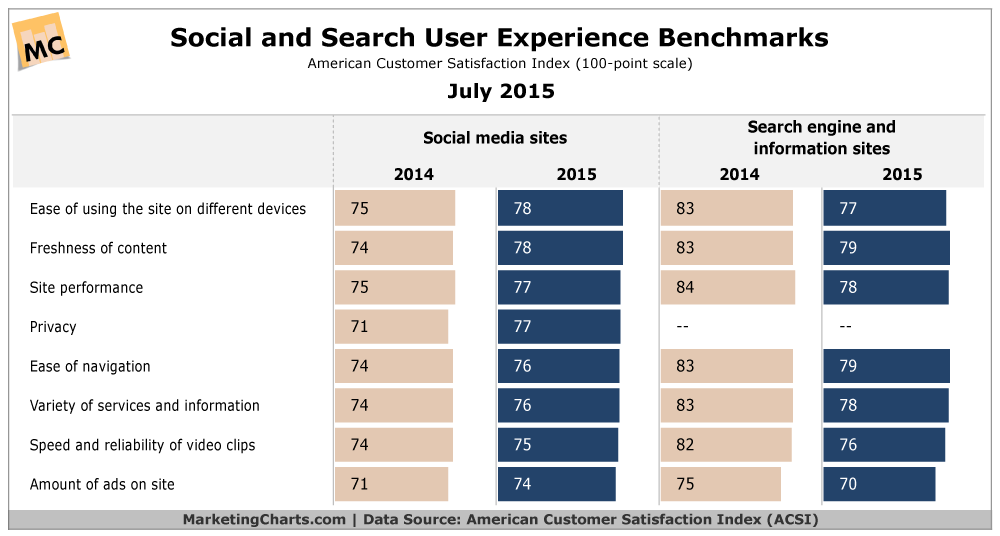
Read MoreSocial & Search User Experience Benchmarks, July 2015 [CHART]
Customer satisfaction with social media sites has risen by 3 points to 74 on a 100-point scale as visitors report growing satisfaction with a variety of user experience elements ranging from privacy to the amount of ads on the sites.
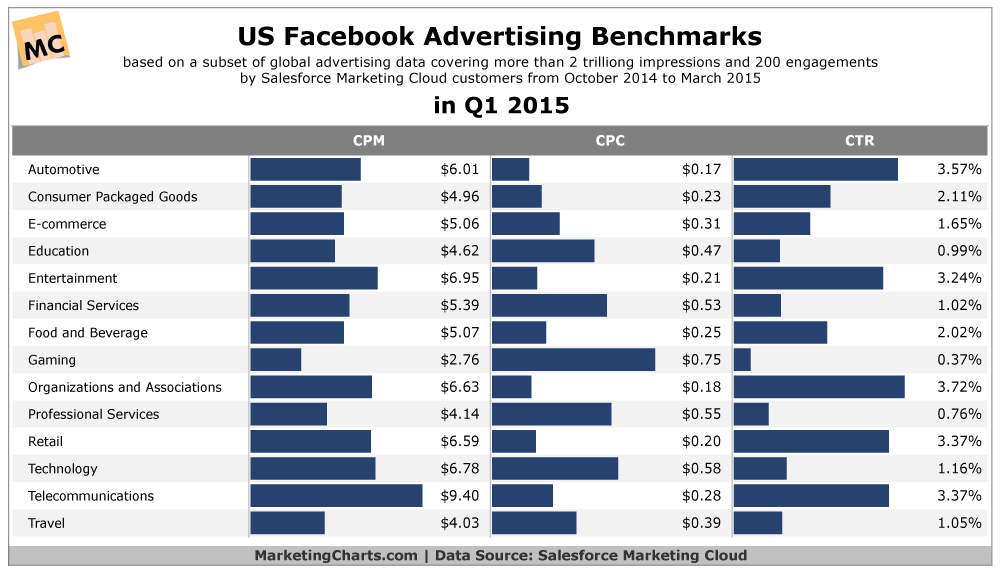
Read MoreFacebook Advertising Benchmarks, Q1 2015 [CHART]
Facebook advertising CPMs were highest for the telecommunications industry and lowest for the gaming vertical in Q1 2015.
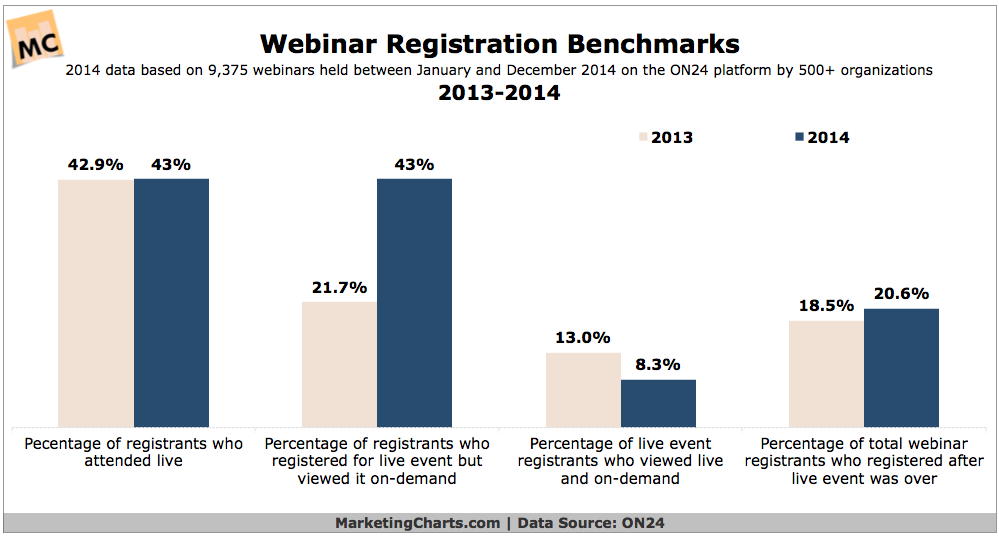
Read MoreWebinar Registration Benchmarks, 2013-2014 [CHART]
The percentage of webinar registrants who attend live has consistently hovered in the 35-45% range for marketing webinars,
Read MoreB2B Cost-Per-Lead By Channel, October 2014 [CHART]
Email marketing (house list), with 66% rating this channel as having a very (30.4%) or somewhat (35.6%) low cost.
Read MoreCosts-Per-Lead Trends, October 2014 [CHART]
A slim majority of marketers and salespeople say that their lead generation effectiveness is improving, while just 1 in 10 see it worsening.
Read MoreBenchmarks: Mobile Commerce By Traffic Source, Q2 2014 [TABLE]
Direct-to-site customers represent the most valuable mobile commerce traffic segment.
Read MoreUS eCommerce Benchmarks By Device, Q2 2014 [TABLE]
Tablets (2.67%) continued to far outpace smartphones (0.94%) in conversion rates in Q2 (as they did in Q1).
Read MoreTwitter Engagement Rates By Day Of The Week, 2013 [CHART]
What’s the best time of day, day of the week, and month of the year to tweet?
Read More