Posts Tagged ‘Benchmarks’
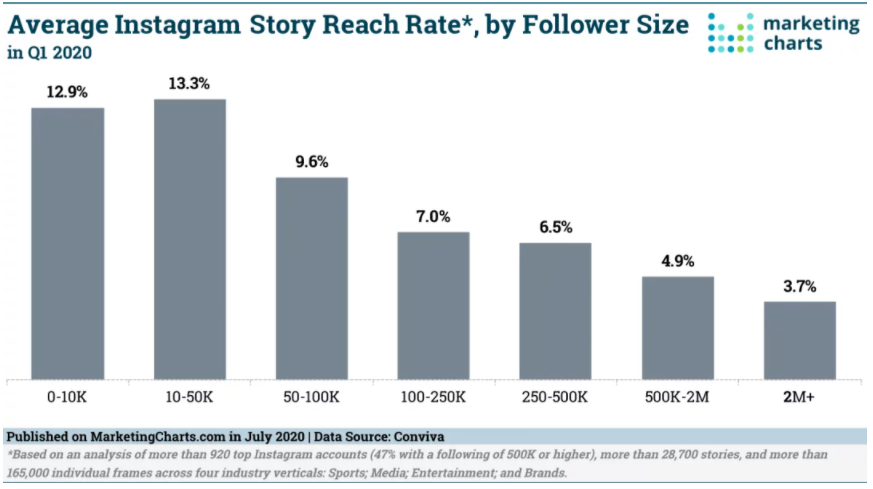
Instagram Story Reach
With more than half of Instagram’s 1 billion-plus users consuming Stories daily and average Story completion rate rising from 73% in 2018 to 87% in 2020, it’s no wonder that brands are turning to the feature to gain reach and engagement.
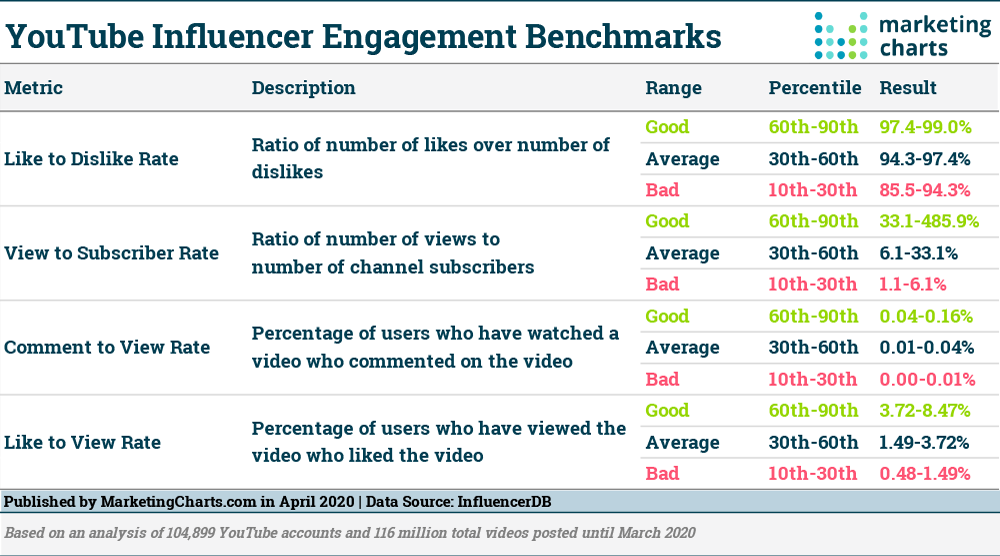
Read MoreYouTube Engagement Benchmarks
A recent report from InfluencerDB reveals some useful benchmarks for engagement rates on YouTube.
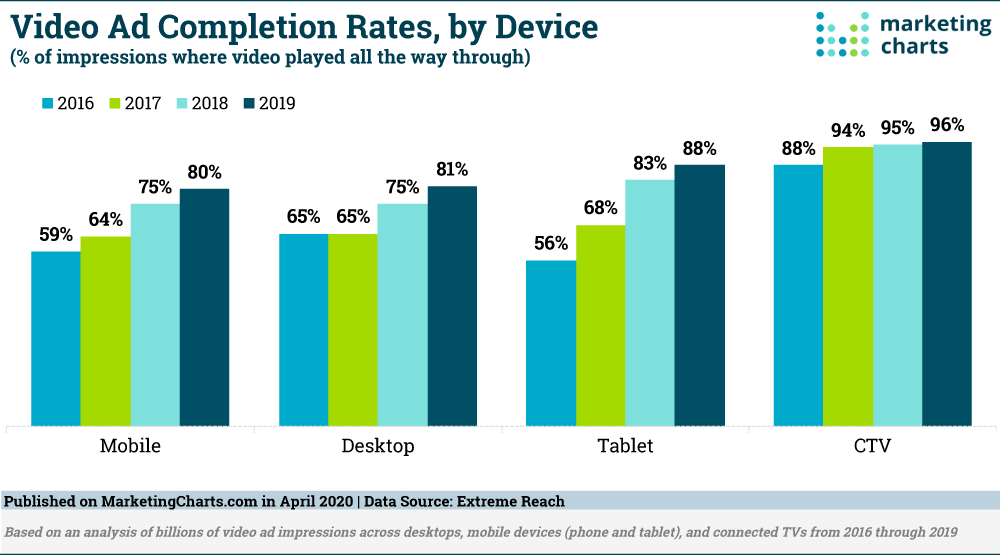
Read MoreVideo Ad Completion Rates By Device
Video completion rates have continued to rise, with Extreme Reach’s figures showing that video ads were viewed to completion 89% of the time last year. This is up from 83% in 2018 and 70% in 2017.
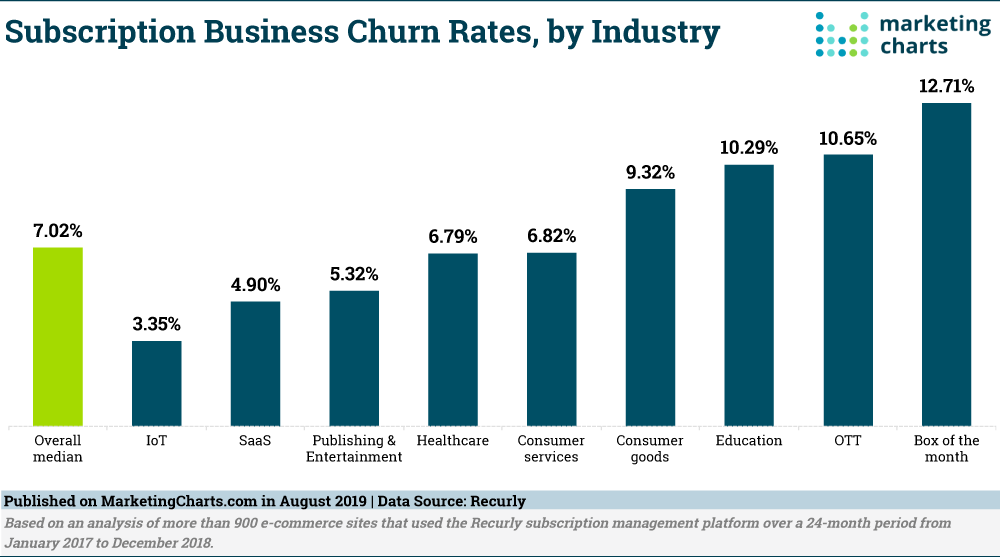
Read MoreSubscription Business Churn Rates By Industry [CHART]
While customers are subscribing to services that provide anything from software, physical products, entertainment to continuing education, they also don’t always stick with those subscriptions.
Read MoreEmail Reading & Dwell Times, 2011-2018
Once opened, the majority of emails manage to catch the reader’s attention, with 61% of all emails being read for 8 seconds or more.
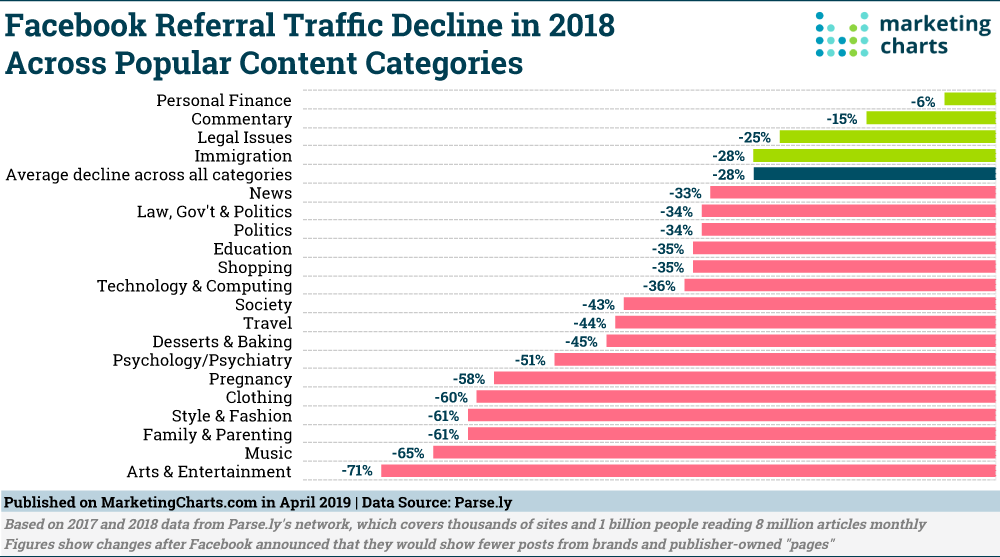
Read MoreFacebook Referral Traffic Declines In 2018 [CHART]
Facebook algorithm changes, which made brand and publisher-owned Facebook pages less visible in consumers news feeds, have had a significantly adverse effect on publishers, according to data published by Parse.ly.
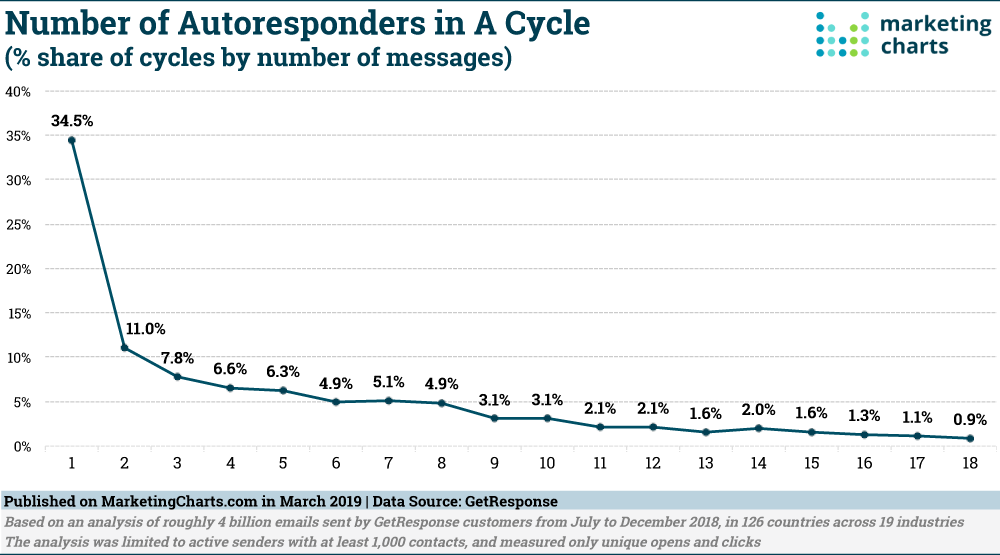
Read MoreAutoresponder Emails Per Cycle [CHART]
Autoresponder emails are a simple way of automating email, but how long should they be? A new report from GetResponse suggests that short and sweet is better – while open (96%) and click (39%) rates on single-message cycles are very high, those with more than 3 messages see a marked drop-off in response rates.
Read MoreHow To Decrease Your Website Bounce Rate [INFOGRAPHIC]
This infographic from Quicksprout illustrates 20 tips for keeping visitors on your website and in the process, minimize your bounce rates.
Read MoreEmail Engagement With New Shoppers [INFOGRAPHIC]
This infographic illustrates the results of a Coherent Path survey of emails sent to new customers by 100 major retailers, such as CVS, Home Depot, and Ralph Lauren.
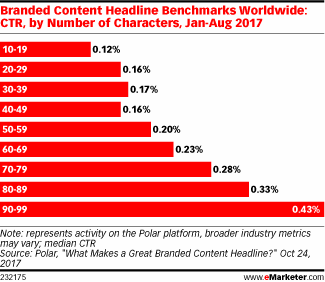
Read MoreCTR By Length Of Brand Content Headline [CHART]
Branded content headlines between 90 and 99 characters achieved a clickthrough rate (CTR) of 0.43%, higher than headlines with fewer characters.
Read More