Posts Tagged ‘beer marketing’
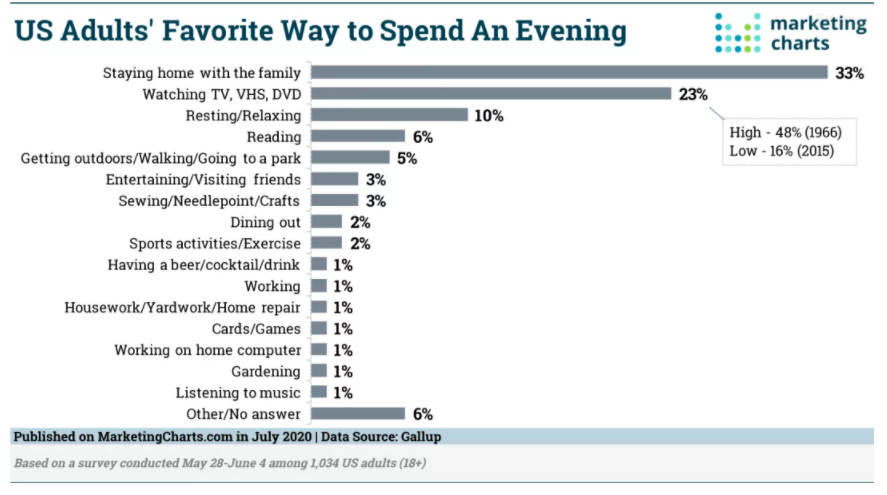
How Americans Spend Their Evenings
For most Americans, staying home with family is their favorite way to spend an evening, per results from a Gallup survey.
Read MoreSaint Patrick's Day [INFOGRAPHIC]
This infographic fom WalletHub illustrates facts and figures about Saint Patrick’s Day 2017.
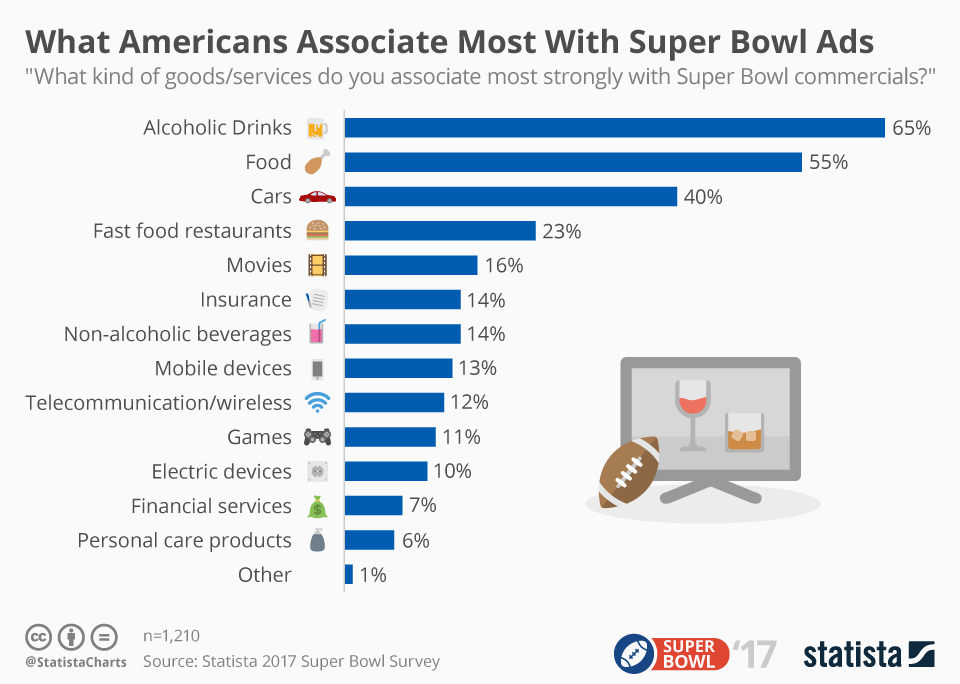
Read MoreWhat Viewers Associate With Super Bowl Ads [CHART]
These days, 65 percent of Americans associate Super Bowl commercials with alcoholic beverages.
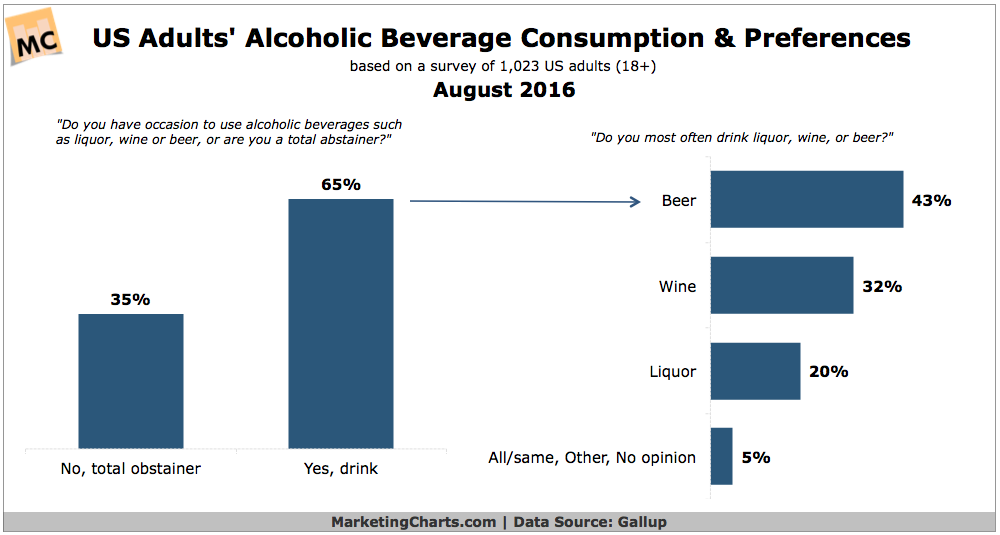
Read MoreAmericans' Alcohol Consumption & Preferences [CHART]
Almost two-thirds (65%) of American adults drink alcoholic beverages on occasion, well within the 55-71% range observed over the past 70-odd years.
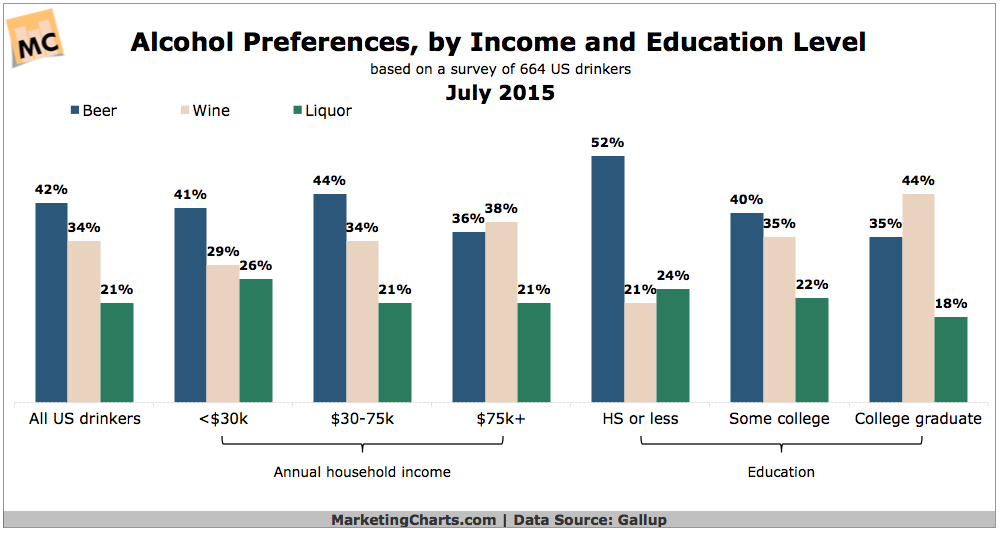
Read MoreAlcohol Preferences By Income & Education, July 2015 [CHART]
Self-reported alcoholic consumption is far higher among Americans from high-income households than lower-income households.
Read MoreMore People Drink Craft Brews Than Drink Budweiser [INFOGRAPHIC]
Budweiser has a 7.6% share of the $100 billion U.S. beer market, down from 10% five years ago, and 14.4% a decade ago.
Read MorePumpkin-Flavored Social Chatter [INFOGRAPHIC]
This infographic from Microsoft looks at social conversations people are having about pumpkin-flavored stuff.
Read MoreOnline Purchase Plans By Category & Region, September 2014 [TABLE]
Consumers around the world tend to be more likely to shop for than buy products online, although the gap between browsing and buying is relatively small for most product categories.
Read MoreGen X & Baby Boomers' Luxury Spending Plans, July 2014 [TABLE]
While Baby Boomers control the largest share of total net worth dollars of any generation, Gen Xers have the most net worth and average household income on a per-adult basis.
Read MoreBaby Boomers' Luxury Buying Plans, July 2014 [TABLE]
Upscale Baby Boomers number about 9 million, or roughly 12% of all Baby Boomers adults (about 75 million).
Read More