Posts Tagged ‘Beauty Marketing’
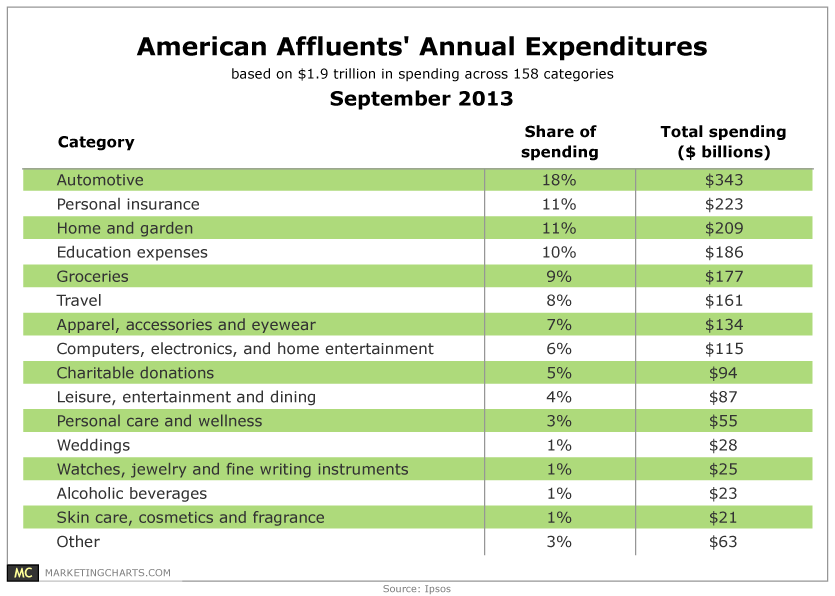
Affluent Americans' Annual Expenditures, September 2013 [TABLE]
Affluent Americans spend $1.9 billion annually – and that those dollars are highly concentrated among a select group of areas.
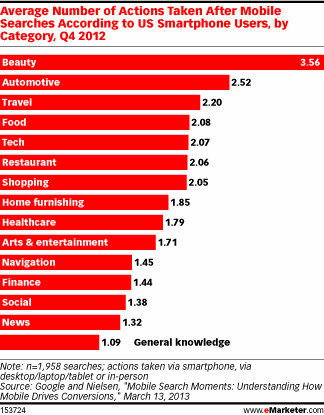
Read MoreAverage Number Of Actions Taken After Mobile Searches By Category, Q4 2012 [CHART]
US smartphone users averaged 2.20 actions after conducting a mobile travel search.
Read MoreYelp Reviews & Small Businesses [INFOGRAPHIC]
This infographic from Merchant Warehouse illustrates Yelp reviews affect on small businesses.
Read MoreImportance Of Price By Gender & Category, July 2013 [CHART]
While 91% of women agree that good value for the money is more important than price, there are a number of categories in which a majority feel that it is extremely or very important to get the lowest prices.
Read MoreMillennials' Preferred Shopping Method By Product Category, February 2013 [CHART]
Among those who purchased electronics and sports equipment/accessories, 38% and 45%, respectively, said they preferred buying these items online.
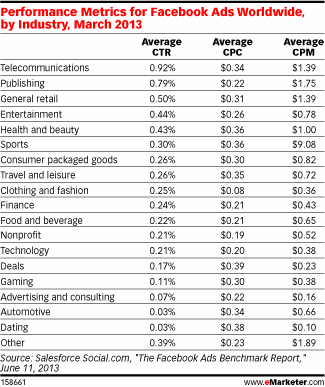
Read MoreGlobal Facebook Advertising Performance Metrics By Industry, March 2013 [TABLE]
For overall Facebook ads served by industry, sports cost by far and away the most, at a CPM of $9.08.
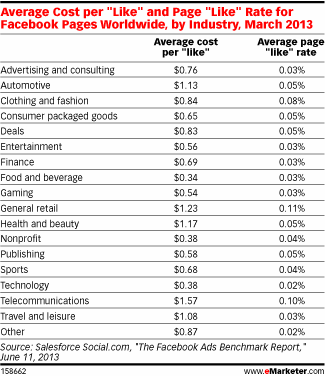
Read MoreGlobal Facebook Cost Per Like By Industry, March 2013 [TABLE]
General retail and telecommunications had the most success generating page “likes,” at a rate of 0.11% and 0.10%, respectively.
Read MoreFacebook Ad Performance By Industry, Q1 2013 [CHART]
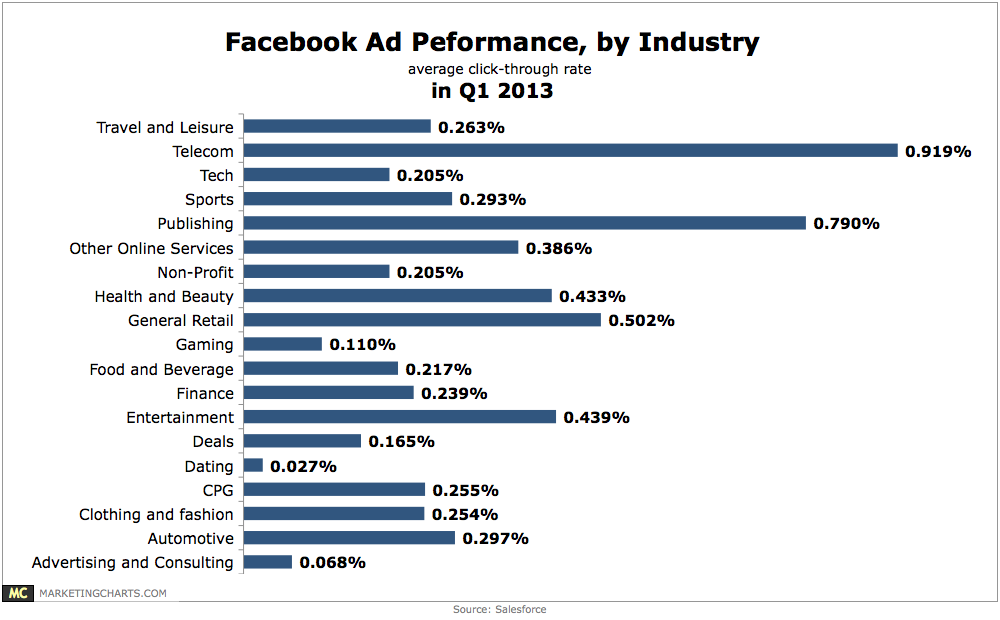
Telecom (0.919%) and publishing (0.79%) brands are leading the charge in Facebook click-through rates.
Read MoreFacebook Ad Performance By Industry, Q1 2013 [CHART]
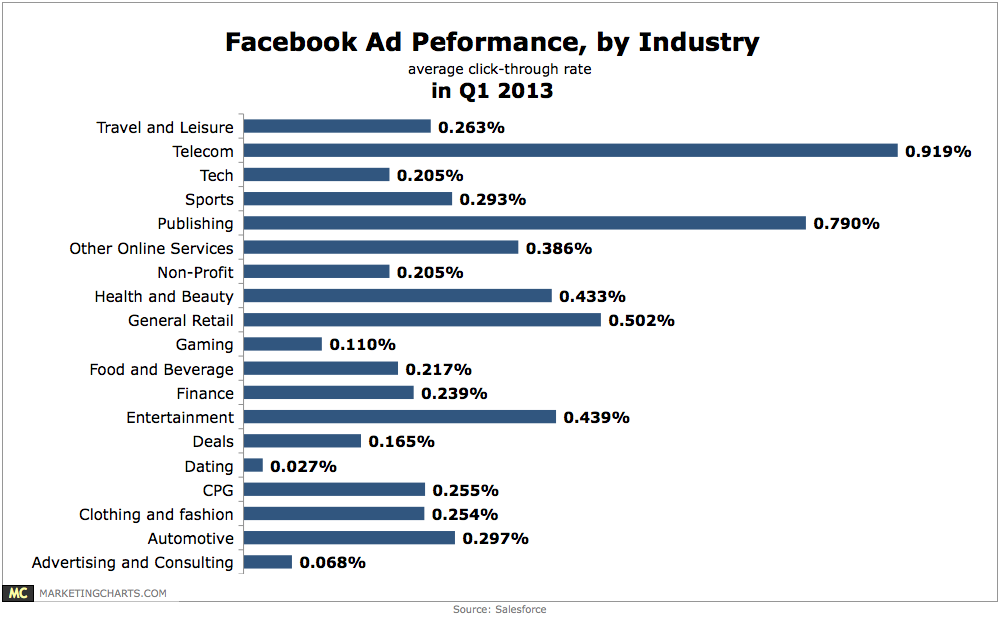
Telecom (0.919%) and publishing (0.79%) brands are leading the charge in click-through rates.
Read MoreProducts Researched & Purchased On A Tablet, March 2012 [TABLE]
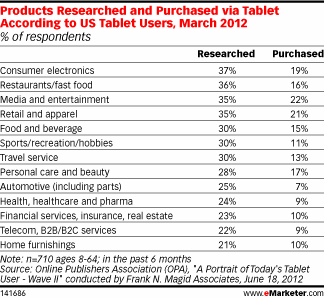
A survey from the Online Publishers Association compared product research with product purchase by category among tablet users in March 2013.
Read More