Posts Tagged ‘Automotive Marketing’
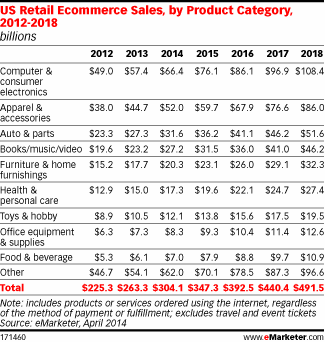
US Retail eCommerce Sales By Product Category, 2012-2018 [TABLE]
Total US retail sales are expected to hit $4.732 trillion this year, with eCommerce sales reaching a greater-than-ever share of the total.
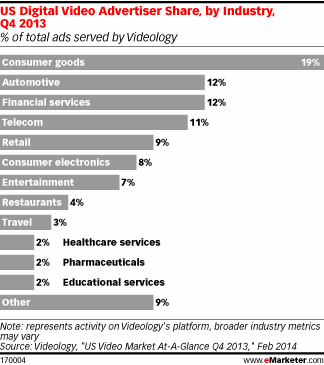
Read MoreUS Online Video Advertising Share By Industry, Q4 2013 [CHART]
Video advertising platform Videology reported that its consumer goods clients in the US were ahead of other verticals in Q4 2013 in serving digital video ads.
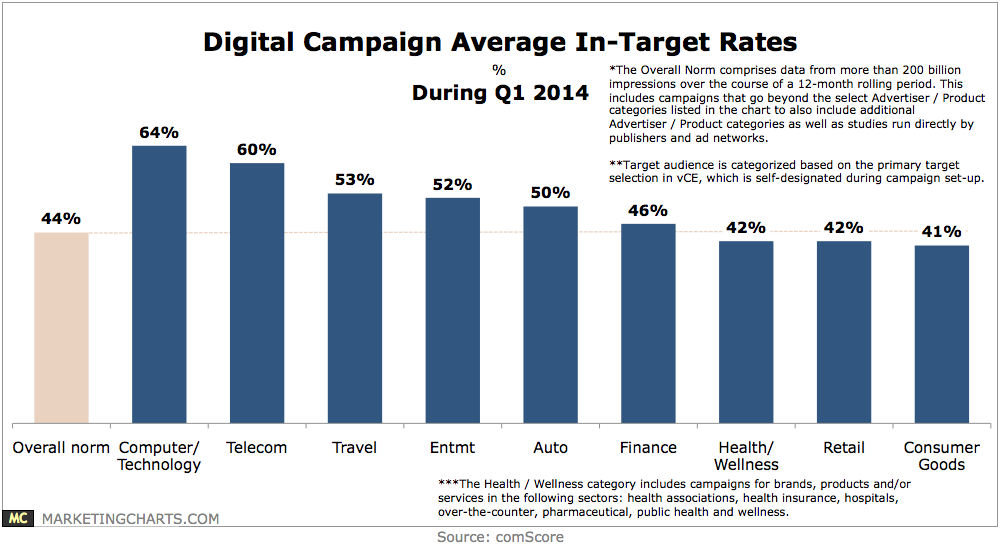
Read MoreOnline Ad Campaign In-Target Rates By Vertical, Q1 2014 [CHART]
In-target rates range from a high of 61% for computer/technology advertisers to a low of 41% for consumer goods campaigns.
Read MoreWebsite Satisfaction By Industry, March 2014 [TABLE]
Social media fares worst, while financial institutions are among the top-rated.
Read MoreMost Frequently Used Omnichannel Research Sources By Category, March 2014 [TABLE]
Study also finds that the path-to-purchase has shortened to a little more than 2 days, even for higher-ticket items.
Read MoreMobile Rich Media & Video Ad CTR vs Standard Banners, 2013 [CHART]
Mobile ads that integrated interactive and animated features saw click-through rates (CTRs) multiple times higher than standard banner ads last year across a variety of verticals.
Read MoreTop Industries By Branded Video Views Worldwide, 2013 [TABLE]
The consumer packaged goods industry saw the most video ad views, with over 2.22 billion.
Read MoreTV Ad Effectiveness By Category In 2013 [TABLE]
Casual dining tops the list this year, taking the top spot from Appliances.
Read MoreAuto Ads That Prompted Consumer Research, May 2013 [CHART]
At the start of the purchase path, mobile, tablet and video ads each laid claim to prompting 34% of buyers to start researching vehicles,
Read MoreProducts/Services Bought On Smart Phone By European Shoppers, March 2013 [CHART]
The top categories of products purchased through smart phones included clothes and accessories, books, electronics and appliances, and tickets.
Read More

