Posts Tagged ‘Australia’
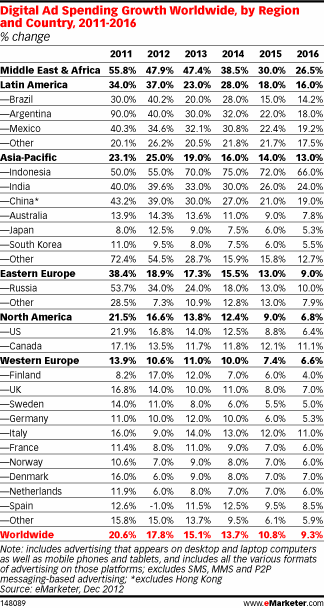
Global Digital Ad Spending Growth By Region & Country, 2011-2016 [CHART]
North America accounts for the greatest share of all digital ad spending, at 39% as of the end of 2012.
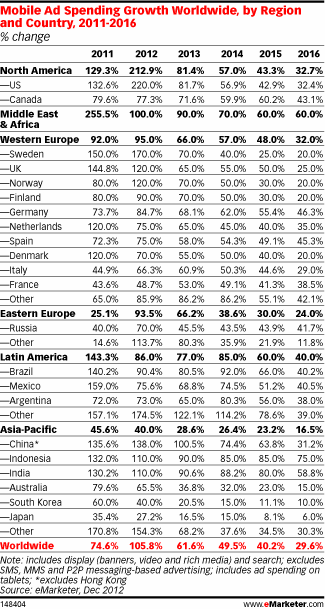
Read MoreGlobal Mobile Ad Spending Growth By Region & Country, 2011-2016 [CHART]
The fastest growth in 2012 came from North America, especially the US, where mobile search and display ad spending was up 220%.
Read MoreMillennials' Views On Technology, Privacy & Identity [INTERACTIVE INFOGRAPHIC]
An interactive infographic by Cicsco that takes a look at Millennials’ views on technology, privacy and identity.
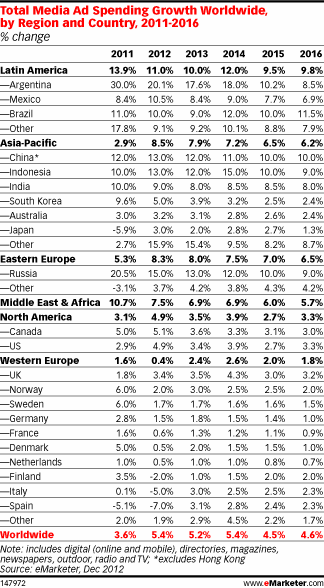
Read MoreMedia Ad Spending By Region & Country, 2011-2016 [TABLE]
The fastest growth during the forecast period will come from Latin America, where ad spending is up 11% this year to $34.66 billion.
Read MoreFrequency Of Digital Content Purchasing By Country, December 2012 [CHART]
11% of internet users in the US say they regularly pay for digital content such as newspapers, TV programs, film, eBooks, music and smart phone apps.
Read MoreMillennials & Customer Experience Feedback, December 2012 [CHART]
67% of American Millennials believe it’s their responsibility to share feedback with companies after a good or bad brand experience.
Read MoreLinkedIn Facts & Figures [INFOGRAPHIC]
This infographic by Website-Monitoring.com compiles the numbers driving LinkedIn’s success.
Read MoreTop Ten Most LinkedIn Countries, June 2012 [CHART]
The US was the top country, with more than 6.8 million small-business professionals. The UK and India were the next most popular countries, with 1.06 million and 1.01 million professionals.
Read MoreCost Of Living In The World [INFOGRAPHIC]
Mercer’s 2012 Cost of Living Survey provides a look at how the cost of common items for an expatriate worker varies dramatically in cities around the world.
Read MoreAustralian Digital Ad Spending, 2010-2016 [CHART]
Australian advertisers spend $196 per internet user on digital and $683 per person on total media in 2012.
Read More


