Posts Tagged ‘Asia Pacific’
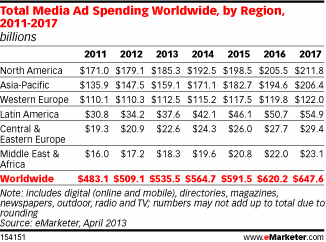
Global Media Ad Spending By Region, 2011-2017 [TABLE]
Growth was solid in 2012, at 5.4%, up from just 3.8% growth in 2011.
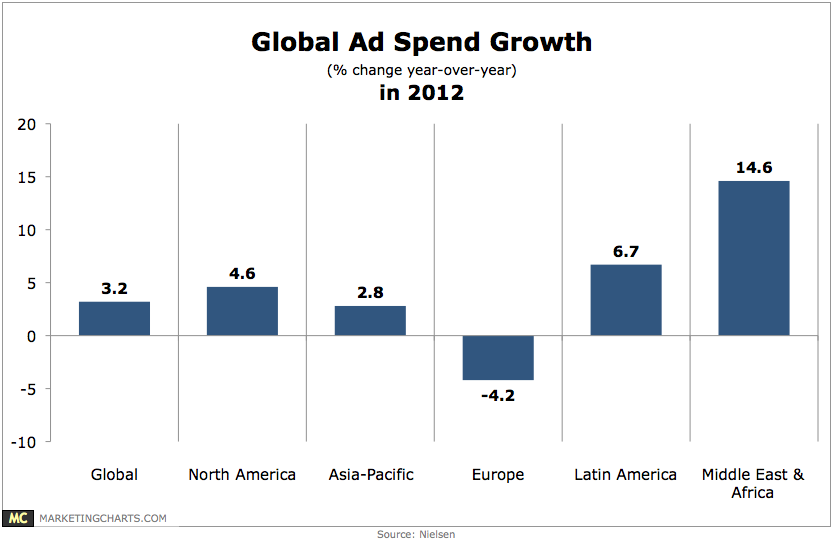
Read MoreGlobal Ad Spending Growth In 2012 [CHART]
Worldwide advertising spending grew by 3.2% year-over-year in 2012 to reach $557 billion.
Read MoreChinese eCommerce [INFOGRAPHIC]
Alibaba expects e-commerce in China to reach $265 billion this year, up from roughly $194 billion in 2012.
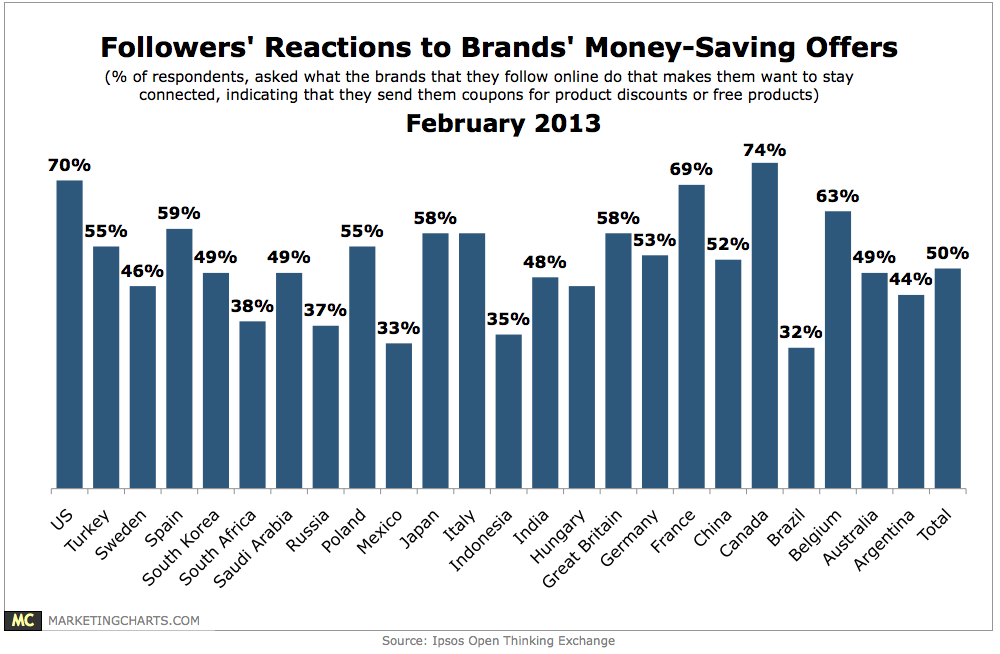
Read MoreAppeal Of Money-Saving Offers Among Social Brand Fans Worldwide, February 2013 [CHART]
7 in 10 Americans who follow brands online say that they want to stay more connected to those brands when they offer them coupons, discounts and free products.
Read MoreGlobal Average B2C eCommerce Sales Per Online Buyer by Region & Country, 2011-2016 [TABLE]
Average spending per user is lower in China but the sheer growth in China’s digital buyers is staggering.
Read MoreGlobal Online Buyers By Country, 2011-2016 [CHART]
The US will remain the single country with the largest share of worldwide B2C ecommerce spending, at 29.6% in 2013—down from 31.5% in 2012 despite relatively strong growth.
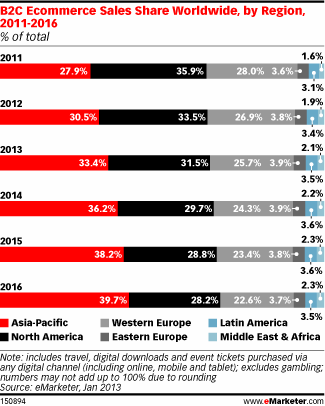
Read MoreGlobal B2C eCommerce Sales By Region, 2011-2016 [CHART]
In 2012, B2C ecommerce sales grew 21.1% to top $1 trillion for the first time.
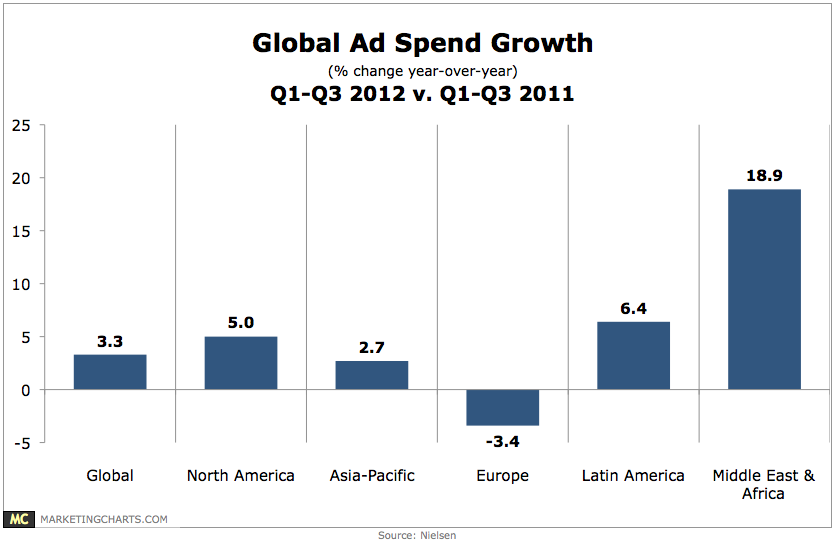
Read MoreGlobal Ad Spending Growth, 2011 vs 2012 [CHART]
Global ad spending grew by 4.3% year-over-year in Q3 2012, picking up steam after a 2.7% gain in the first half of the year.
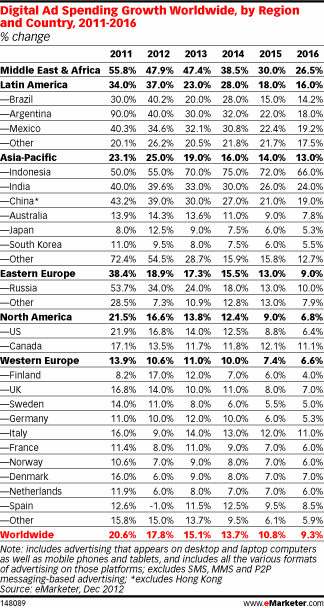
Read MoreGlobal Digital Ad Spending Growth By Region & Country, 2011-2016 [CHART]
North America accounts for the greatest share of all digital ad spending, at 39% as of the end of 2012.
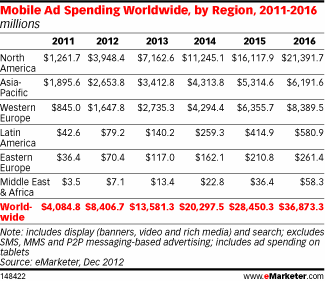
Read MoreGlobal Mobile Ad Spending By Region, 2011-2016 [CHART]
North America already has an edge on other world regions, and will widen that gap considerably by 2016.
Read More