Posts Tagged ‘Apple’
Mobile Share Of Search Traffic, Q1 2013 [CHART]
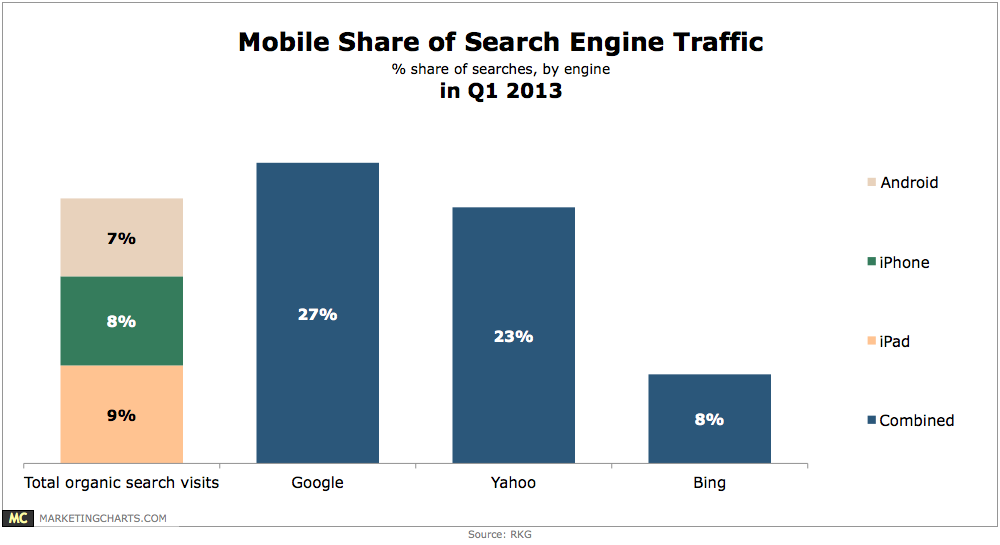
Tablets and smart phones combined accounted for roughly 24% of organic search visits in Q1.
Read MoreTime Spent On iOS & Android Devices By Activity, April 2013 [CHART]
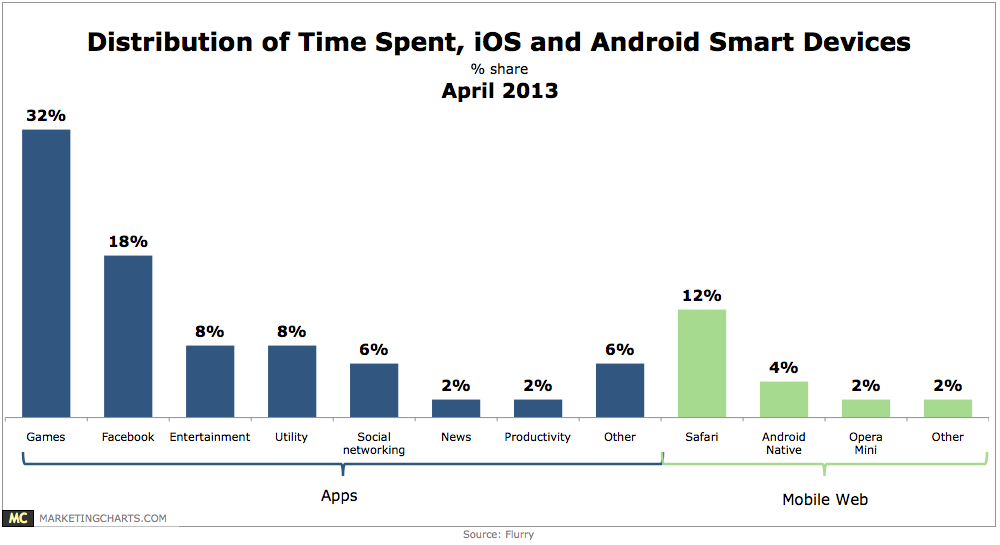
Android and iOS smart phone and tablet users spend an average of 2 hours and 38 minutes per day on their devices.
Read MoreUS Net Mobile Display Ad Revenue Share By Company, 2011-2015 [TABLE]
Facebook, the No. 2 mobile ad publisher in the country, accounted for 9.5% of mobile ad revenues in 2012 and is expected to take 13.2% this year.
Read MoreUS Net Mobile Ad Revenues By Channel, 2011-2015
eMarketer revised its estimate for 2012 spending only slightly upward from the previous forecast in December 2012.
Read MoreApple Free vs Paid App Revenues, February 2013 [CHART]
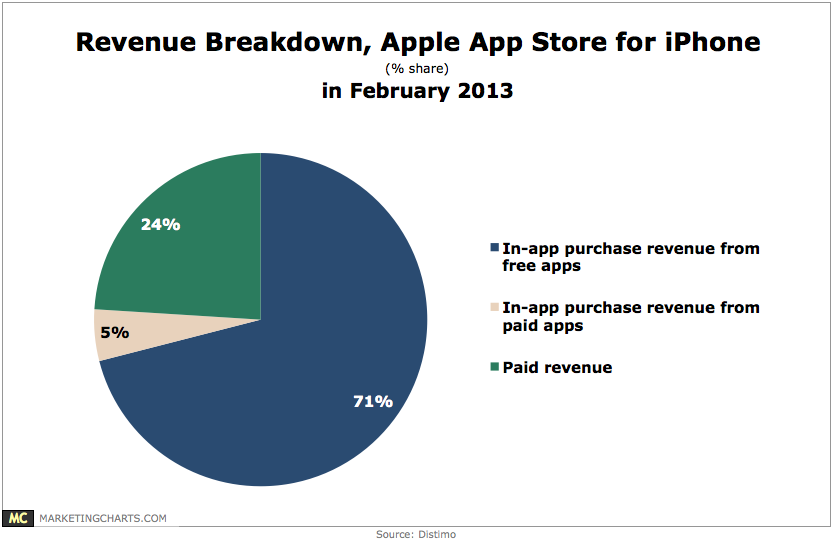
In-app purchases accounted for a new high of 76% of revenue in the Apple App Store for iPhone in February 2013, up from 53% in January of last year.
Read MoreFacebook Smart Phone Use By Weekday vs Weekend, March 2013 [CHART]
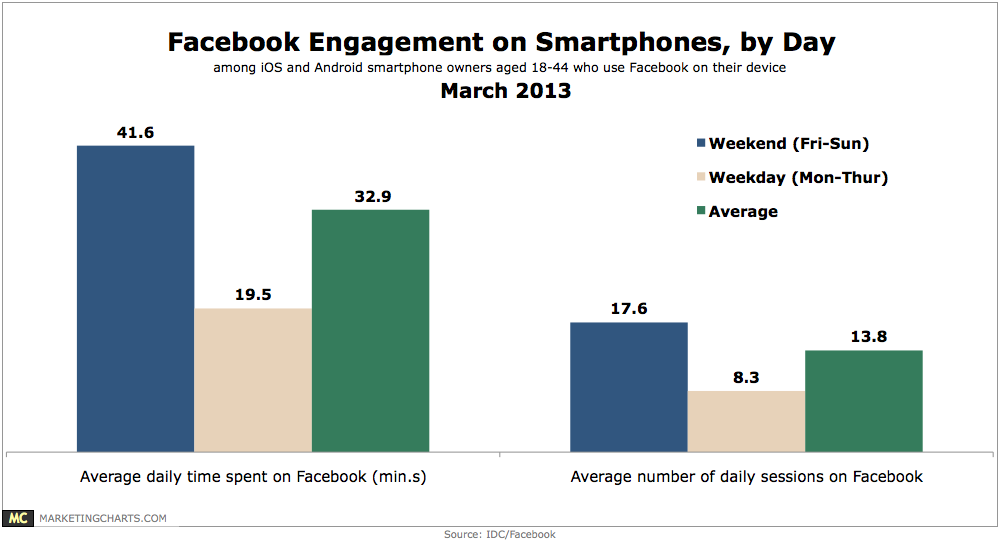
70% who use Facebook on their smart phone spend more than twice as much time doing so on the weekend (defined as Friday through Sunday) than on a typical weekday.
Read MoreTop Multi-Platform Properties, February 2013 [TABLE]
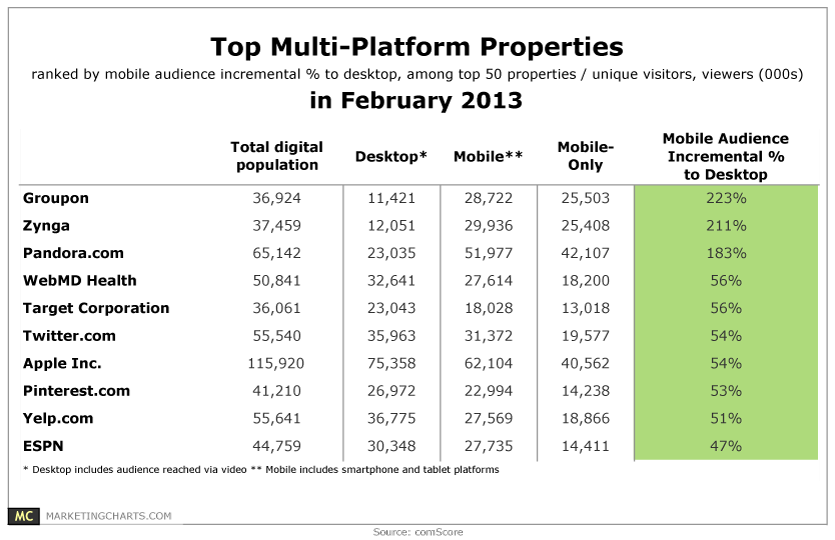
Including mobile audience counts into a web property’s total audience makes a significant difference to reach and rankings.
Read MoreRevenues & Profits Of Tech Giants [INFOGRAPHIC]
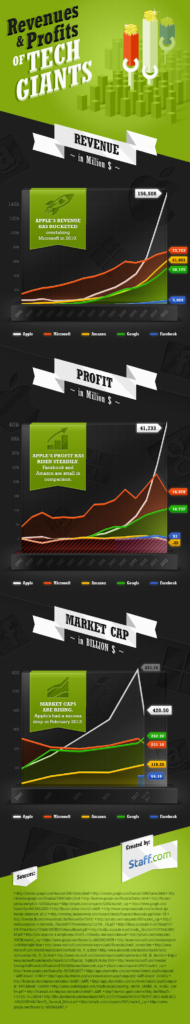
This infographic from Staff.com illustrates the financial performance of Apple, Microsoft, Amazon, Google and Facebook.
Read MoreLuxury Brand Mobile Apps By Platform, December 2011 & January 2013 [TABLE]
70% of 100 select luxury brands had at least one iOS mobile app in January 2013—the same percentage that had one in December 2011.
Read MoreMobile Gaming Metrics Of Android & iPhone Users, December 2012 [TABLE]
iPhone users were 10 percentage points more likely than Android users to be gamers.
Read More