Posts Tagged ‘Android’
Global Mobile Payment Transactions By Device, June 2012 vs April 2013 [CHART]
Europe sports the world’s largest percentage of transactions made using a mobile device, at 15.3%, followed by Asia (12.4%) and North America (11.2%).
Read MoreDemographics Of US Android & iPhone Owners, May 2013 [TABLE]
Android phones had a 12 percentage point lead over iPhones, with 43% of mobile phone owners between 18 to 24 years old on Android smartphones, compared with 31% on the iPhone.
Read MoreUS Smart Phone Owners By OS, May 2013 [CHART]
In May 2013, Android was ahead of iOS by 3 percentage points; Android ran on 28% of mobile phone owners’ smart phones, compared with 25% on iPhones running iOS.
Read MoreTop Mobile Devices By Ad Performance, Q1 2013 [TABLE]
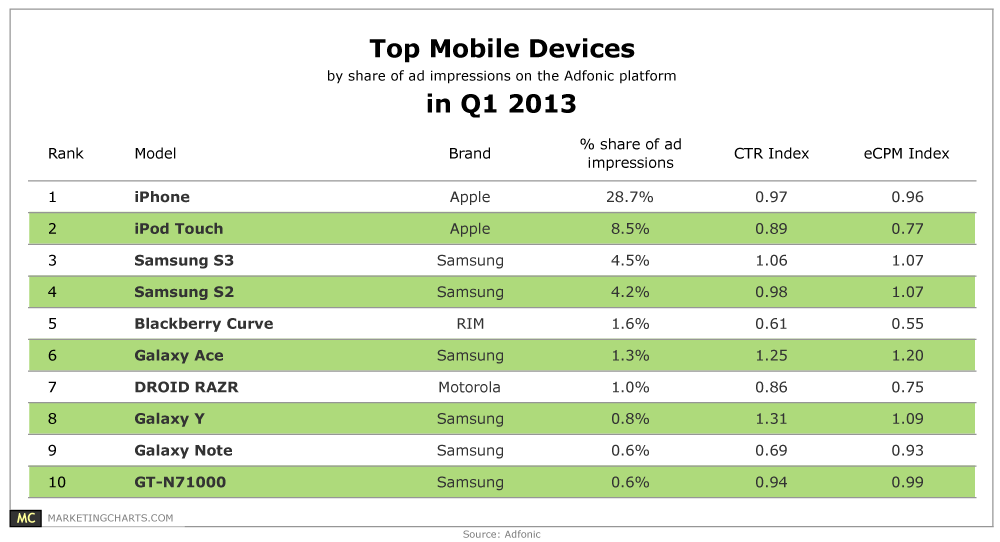
Samsung mobile devices on the whole sported higher click-through rates than the iPhone in the US and UK during Q1.
Read MoreSmart Phone Activity Share By OS, May 2013 [CHART]
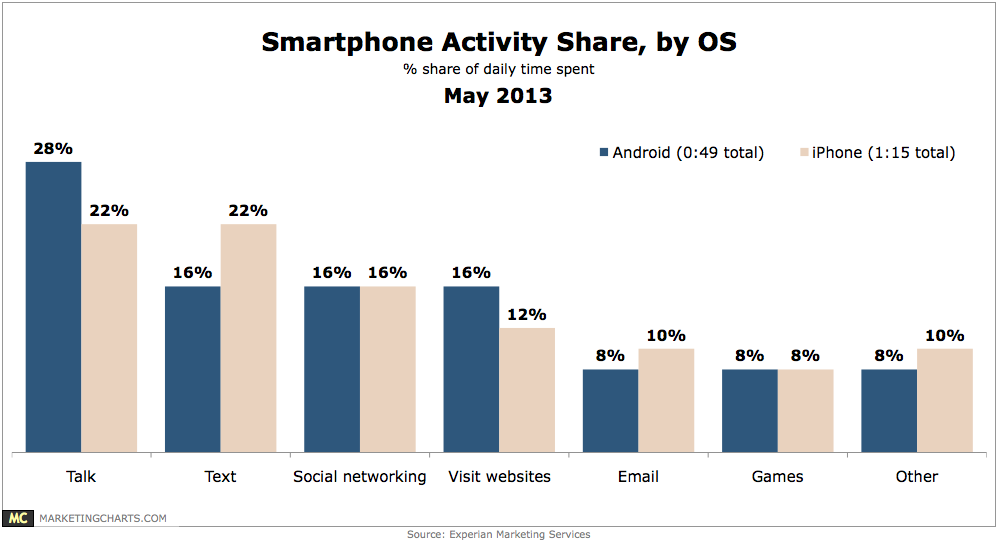
Americans spend about an hour each day on their smart phones (58 minutes to be exact).
Read MoreMobile & Tablet Video Ad Views By OS, Q1 2013 [CHART]
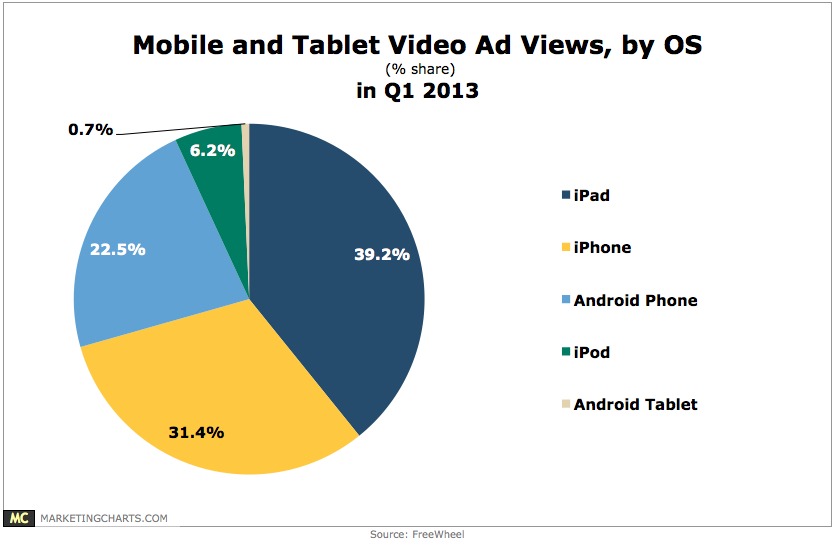
More mobile video ad views took place on an iPhone (31.4% share of mobile and tablet ad views) than an Android phone (22.5% share) in Q1.
Read MoreSmart Device Users Worldwide By OS & Form Factor, February 2013 [CHART]
The vast majority of Android and iOS devices in use on the Flurry platform—and all Window devices—were medium phones.
Read MoreGlobal Share of Mobile Real-Time Bidding Ad Views By OS, Q1 2013 [CHART]
In-app advertising accounted for the bulk of mobile RTB ads, at 93% of ads viewed. Browsers accounted for the remaining 7%.
Read MoreMonthly Average CTR For Q1 2013 By Mobile Device [CHART]

Advertisers devoted roughly three-quarters of their budgets to iOS devices during Q1 2013.
Read MoreMobile Ad Traffic By Device, Q4 2012 vs Q1 2013 [TABLE]

Among mobile platforms, Apple’s iOS leads in monetization performance on the Opera Advertising mobile platform.
Read More