Posts Tagged ‘Amazon’
Revenues & Profits Of Tech Giants [INFOGRAPHIC]
This infographic from Staff.com illustrates the financial performance of Apple, Microsoft, Amazon, Google and Facebook.
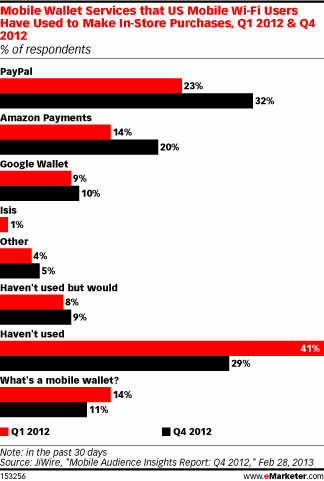
Read MoreMobile Wallet Services Used For In-Store Purchases, Q1 2012 & Q4 2012 [CHART]
About one-third of mobile Wi-Fi users had used PayPal during the 30 days preceding the poll, compared with 20% for Amazon and 10% for Google.
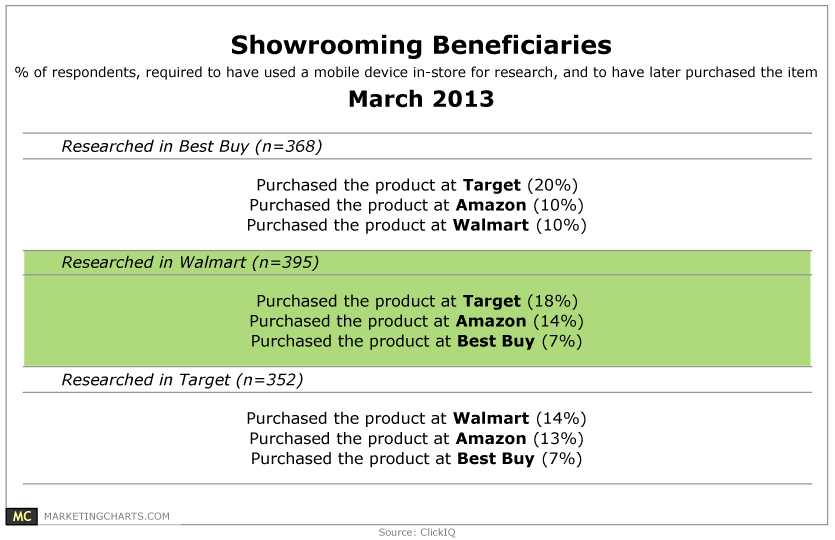
Read MoreRetailers Benefiting From Showrooming, March 2013 [TABLE]
Among those who researched a product while at Best Buy, twice as many ended up purchasing the item at Target (20%) as did at Amazon (10%).
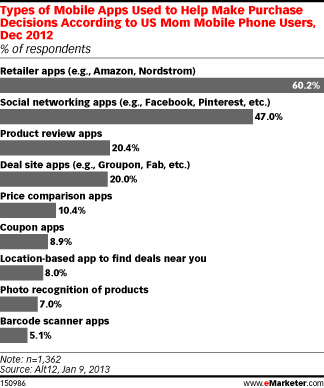
Read MoreTypes Of Mobile Apps Moms Use To Aid Purchase Decisions, December 2012 [CHART]
60% of moms reported that retailer apps were the most popular apps to help them make purchase decisions.
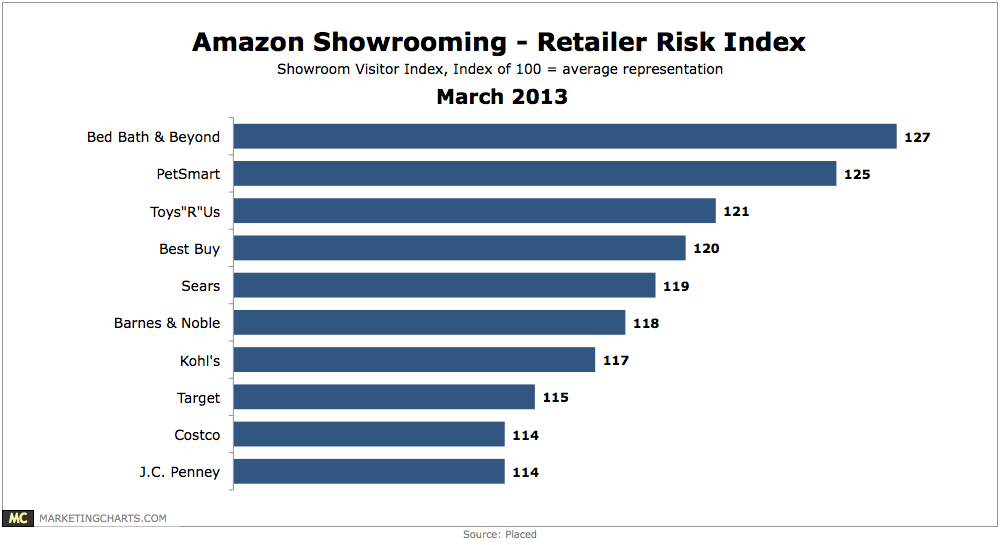
Read MoreAmazon Showrooming, March 2013 [CHART]
Study looks at which retailers are most at risk of showrooming behavior, by examining showroomers’ propensity to visit the retailer before buying an item on Amazon.
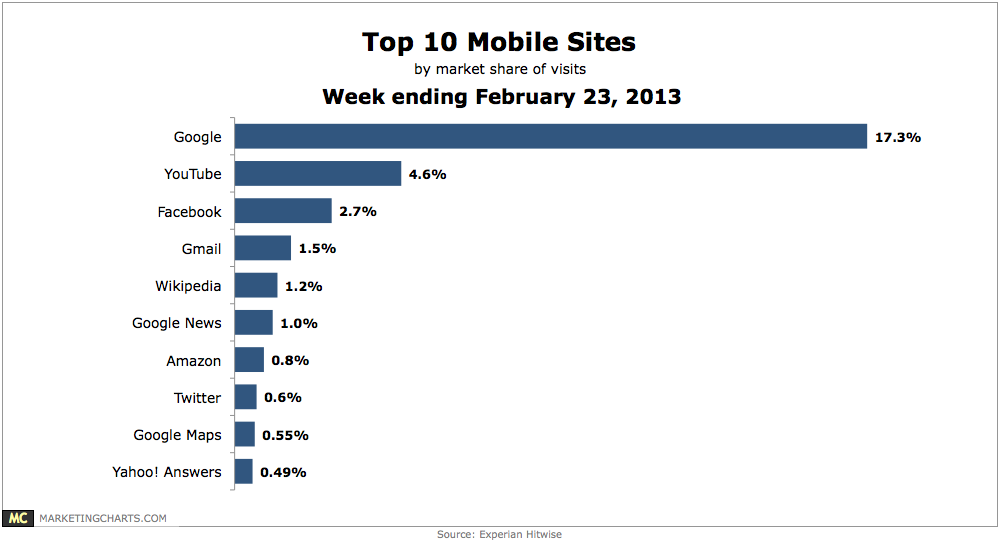
Read MoreTop 10 Websites By Share Of Mobile Visits, February 2013 [CHART]
Google ranks as the top site, with 17.3% market share of visits.
Read MoreTech Lobbying Spend By Company, 2012 [CHART]
Facebook’s contributions are up 200% year-over-year – as they seek to carve out breathing room from federal regulators.
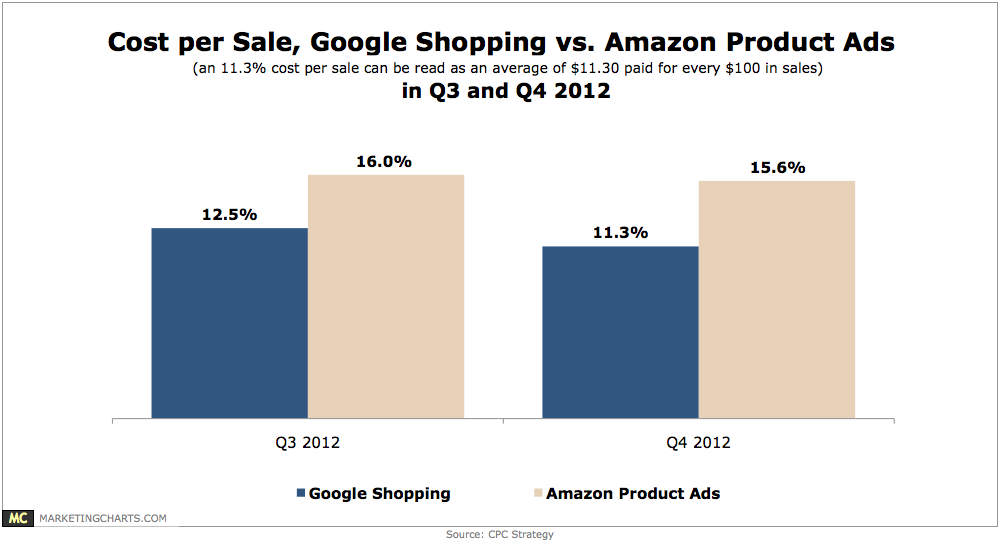
Read MoreGoogle Shopping vs. Amazon Product Ads, Q3 & Q4 2012 [CHART]
In the second half of 2012 (H2), Google Shopping proved 32.8% more cost-effective for advertisers than Amazon Product Ads.
Read MoreBeyond Social Media: Carnival Triumph Cruise's Megafail & Lotsa Love Stuff [PODCAST]
This week’s highlights include the Carnival Triumph Cruise Megafail, an Etch-A-Sketch tribute, Ice Cream love, love stories & songs, a House of Cards.
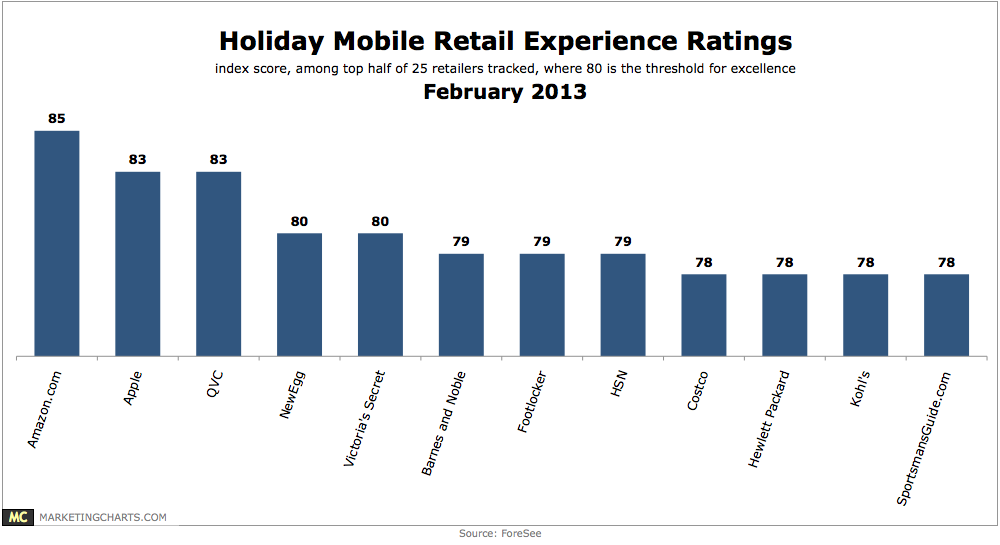
Read MoreHoliday Mobile Retail Experience Ratings by Select Brands, February 2013 [CHART]
Amazon led all retailers tracked in customer satisfaction with mobile retail experiences during the holiday period.
Read More
