Posts Tagged ‘Advertising Metrics’
Ad Click-Through Rate By Format, 2012 [CHART]
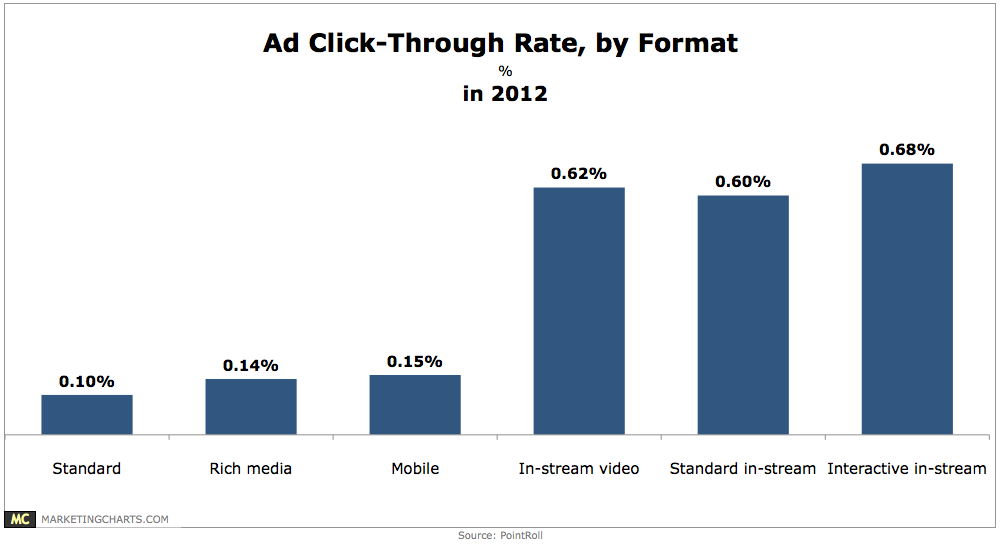
In-stream video ads achieved an average click-through rate (CTR) of 0.62% last year, far outpacing mobile (0.15%), rich media (0.14%) and standard banner (0.1%) ads.
Read MoreInteractive Online Video Advertising Effect On Branding, Q2 2012 [CHART]
A Q2 2012 study from Millward Brown, Dynamic Logic and YuMe found that in most cases, interactive ads delivered greater brand metric results.
Read MoreNative vs. Banner Ads, May 2013 [CHART]
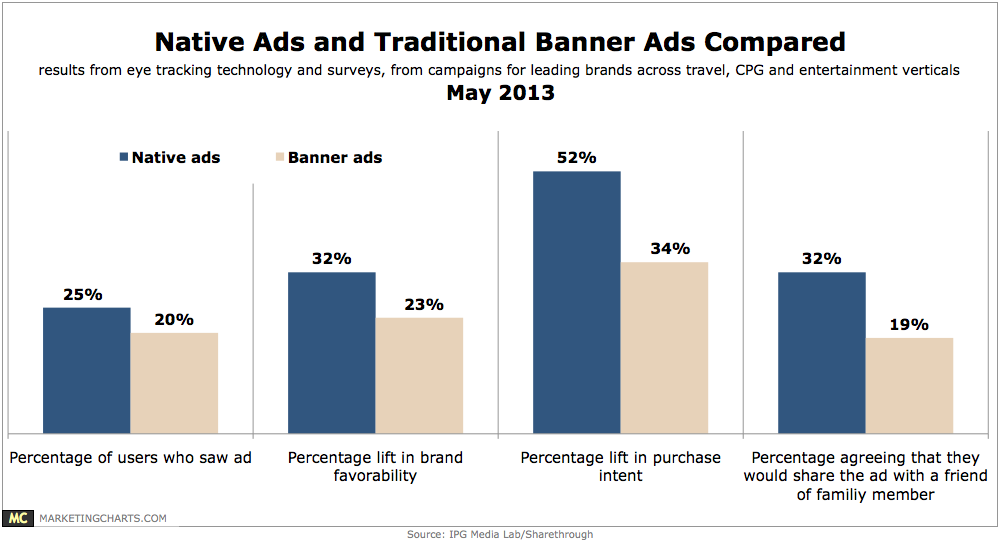
A study pitting native ads against banner ads has found the former attracting more attention and generating more lift.
Read MoreBrand Lift Performance For Advanced Tablet Ads, October 2012 [TABLE]
The banner to full-page ad showed 380% greater mobile ad awareness over the control group who had not seen any ad.
Read MoreEngagement & Click-Through Rates For Advanced Tablet Ads, October 2012 [TABLE]
At a clickthrough rate (CTR) of 8.7%, the banner to full-page ad’s clickthrough performance on tablets was more than four times greater than the static web banner.
Read MoreCompletion Rates By Length Of Mobile Rich Media Video Ads, April 2013 [CHART]

Completion rates for very short videos (less than 30 seconds) had the lowest completion rate (35.8%), behind even the longest ads (150 seconds and longer), which had a roughly 50% completion rate.
Read MoreVideo Advertising Impressions By Format, 2010-2012 [CHART]
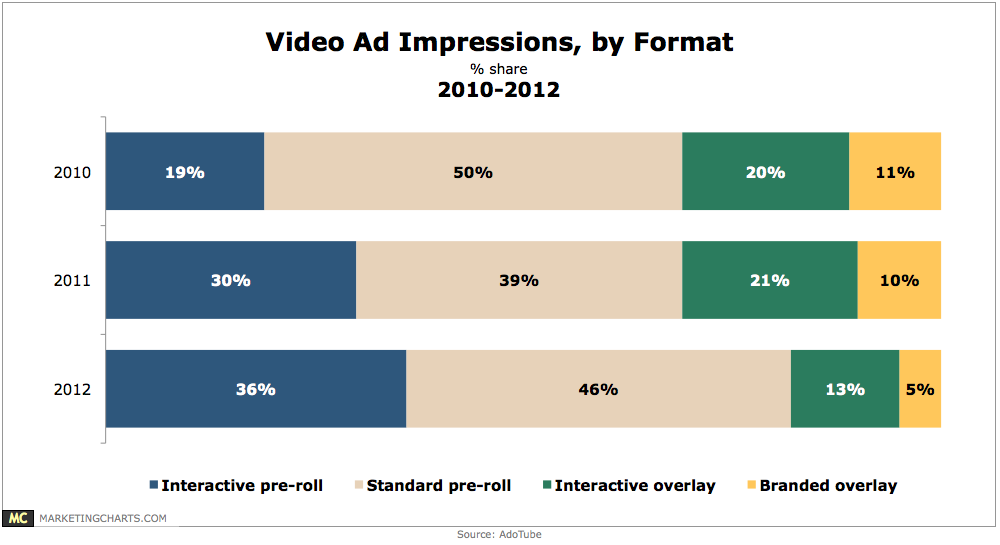
Interactive pre-rolls represented 36% of video ad impressions in 2012.
Read MoreTablet Ad Click-Through Rate Uplift By Industry, December 2012 [CHART]
Click-through rates for entertainment and media, as well as the travel category rose by 81% and 66%, respectively.
Read MoreUS Ad CTR Benchmarks By Format [CHART]
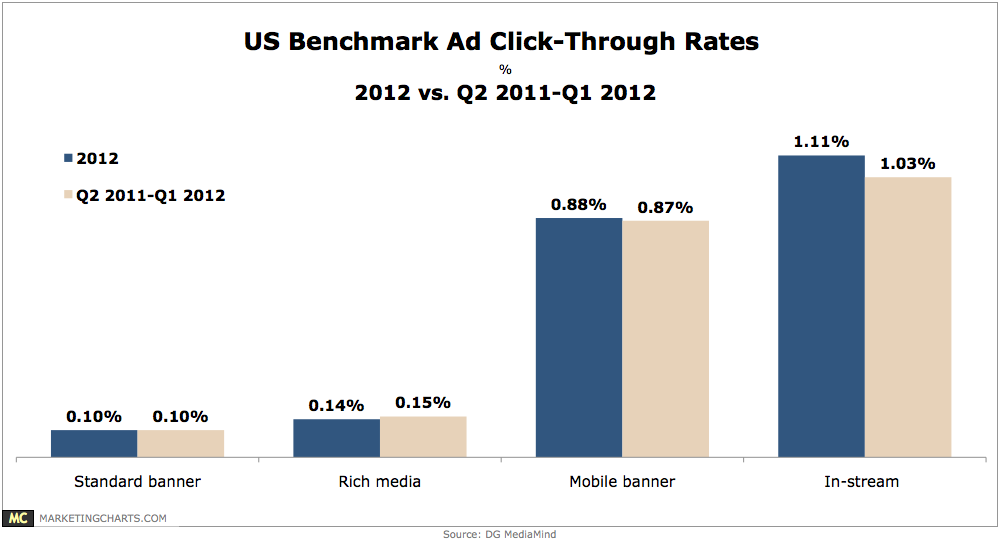
In the US, the average click-through rate (CTR) for in-stream video ads was 1.11% in 2012, up from 1.03% in the previous study (covering Q2 2011 – Q1 2012).
Read MoreMobile Cyber Monday Ad Metrics, 2011 vs 2012 [CHART]
MediaMind’s platform served 46.2% more standard mobile banner, video and rich media impressions on Cyber Monday in 2012 than 2011.
Read More