Posts Tagged ‘Advertising Metrics’
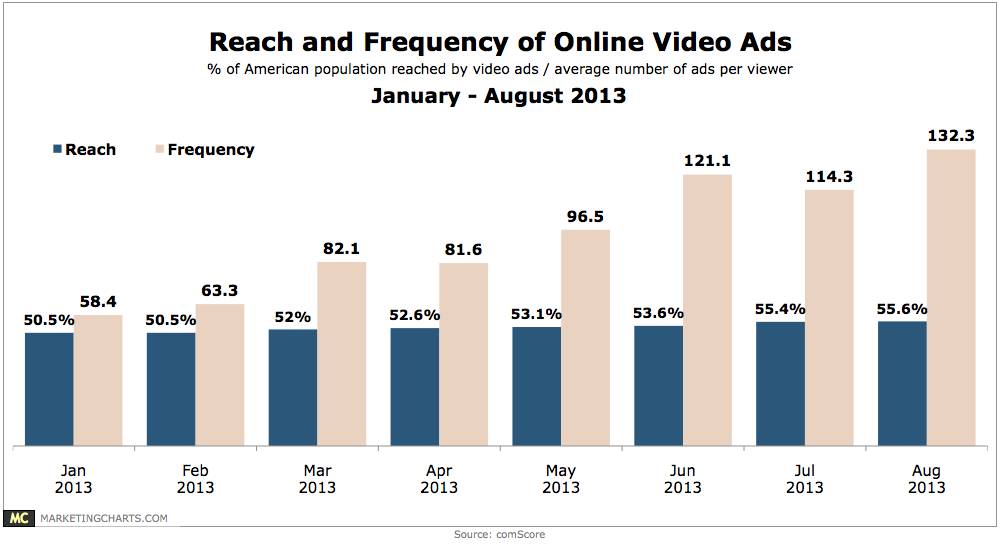
Reach & Frequency Of Video Ads, January – August 2013 [CHART]
In August, the average viewer saw 132 ads, besting the previous high of 121 set in June, and more than doubling January’s average of 58.
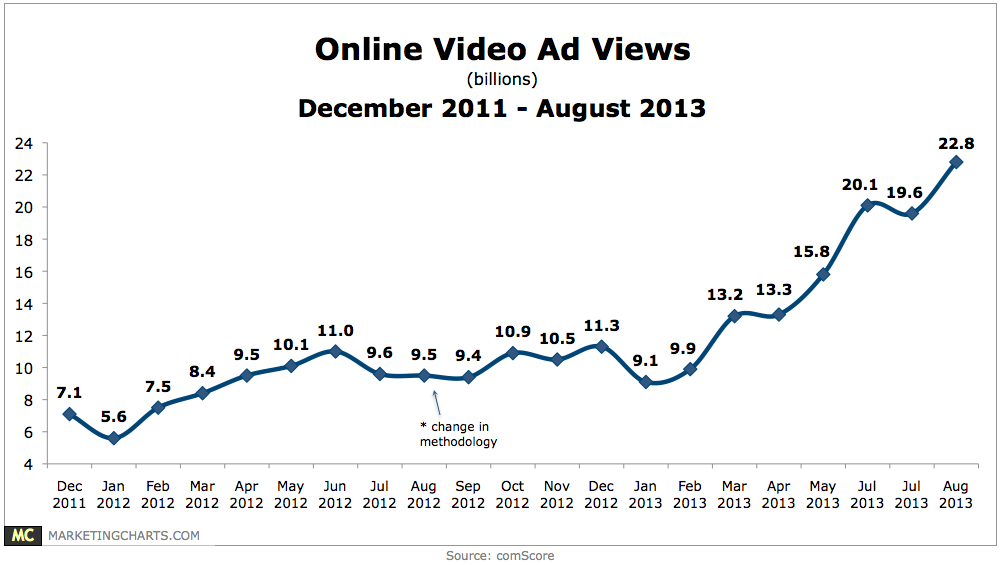
Read MoreOnline Video Ad Views, December 2011 – August 2013 [CHART]
Online video ad views have been increasing rapidly this year, reaching a new high of 22.8 billion in August after a slight dip in July.
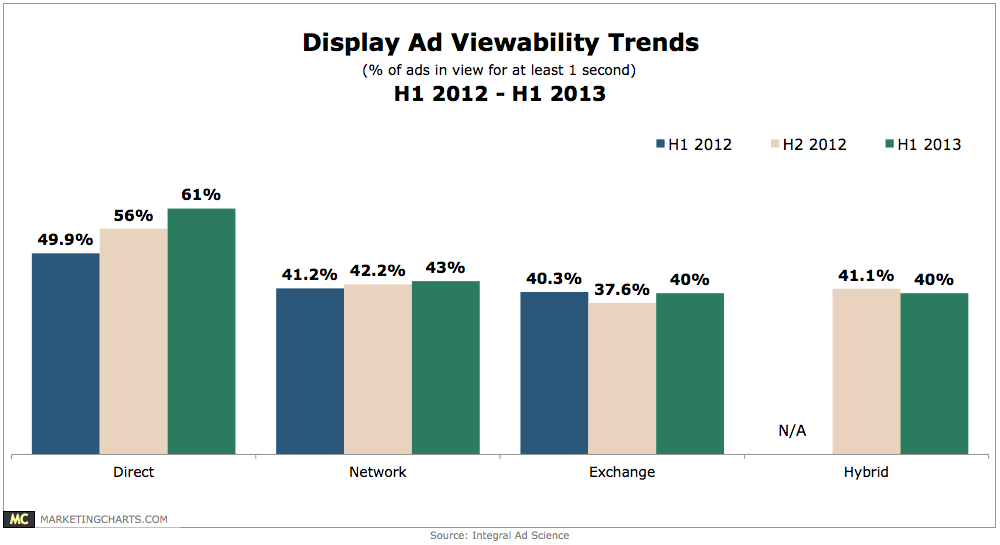
Read MoreDisplay Ad Viewability Trends, H1 2012 – H1 2013 [CHART]
61% of directly placed ads stayed in-view for at least 1 second during the fist half (H1) of 2013, up from 56% in the second half of 2012 and 49.9% in H1 2012.
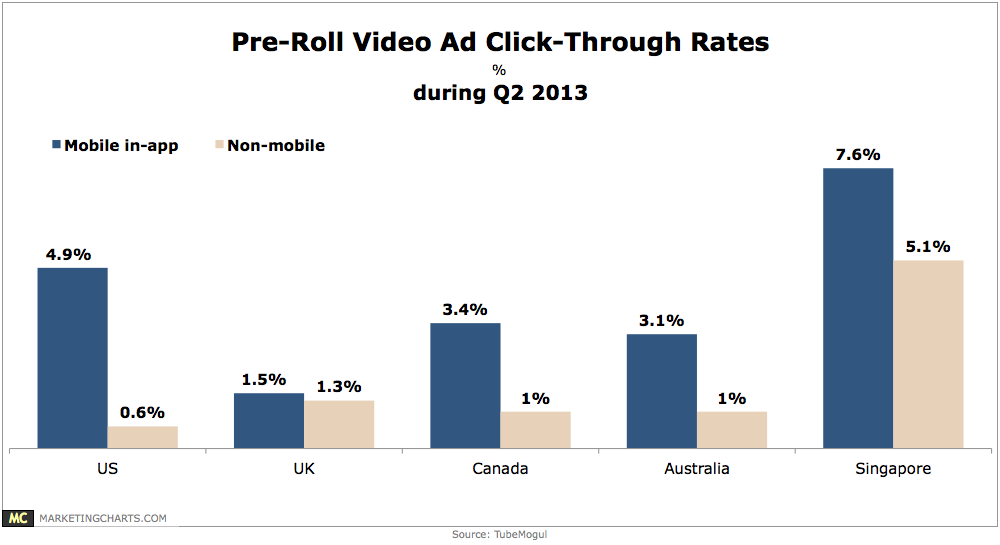
Read MorePre-Roll Video Ad Click-Through Rates, Q2 2013 [CHART]
Slightly more than half of mobile in-application pre-roll ads were completed in the US during Q2.
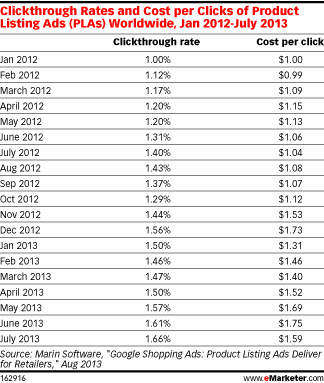
Read MoreProduct Listing Ad Metrics, January 2012-July 2013 [TABLE]
The outlook for PLAs is good given that the ads do seem to garner higher clickthrough rates (CTRs) every month.
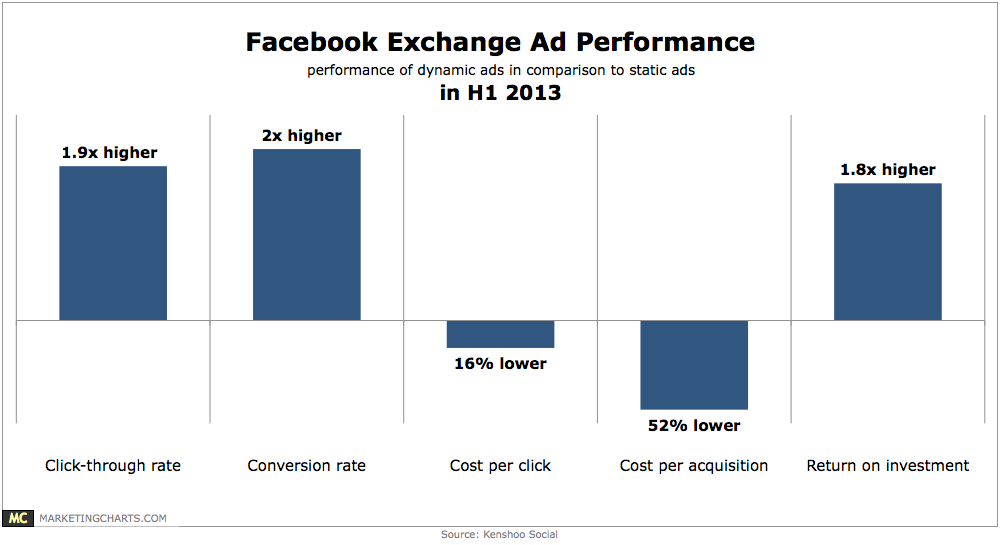
Read MoreFacebook Exchange Ad Performance, H1 2013 [CHART]
Facebook exchange units can deliver an ROI comparable to other search and direct response channels, but that’s more likely to be the case for dynamic than static units.
Read MoreLanding Page Optimization Metrics, August 2013 [TABLE]
The greatest percentage considered conversion to be the most useful metric for analyzing the performance of their landing pages.
Read MoreReach & Frequency Of Online Video Ads, January – July 2013 [CHART]
Online video ad reach took a step forward in July, increasing to 55.4% of the US population from 53.6% in June.
Read MoreFacebook Ad Performance Metrics, Q2 2013 [CHART]
Facebook click-through rates were up by 18.5% quarter-over-quarter, leading to a 15.9% drop in average cost-per-click and a 16.4% rise in clicks.
Read MoreOnline Ad Spending Measurement Metrics, February 2013 [CHART]
Fifty-four percent said they would prefer to use the same metrics they use for offline campaigns, alongside additional metrics particular to online.
Read More