Posts Tagged ‘Advertising Metrics’
Mobile Display Ad Viewability Metrics By Ad Size, Q3 2014 [TABLE]
Screenwide display ads on mobile were tops for viewability.
Read MoreMobile Ad CTRs By Device & Platform, H1 2014 [CHART]
Mobile ads served in applications had a significantly higher click-through rate (CTR) than those served on the mobile web (0.56% and 0.23%, respectively) during the first half of this year.
Read MoreMobile Video Ad Benchmarks By Length & Format, April 2014 [CHART]
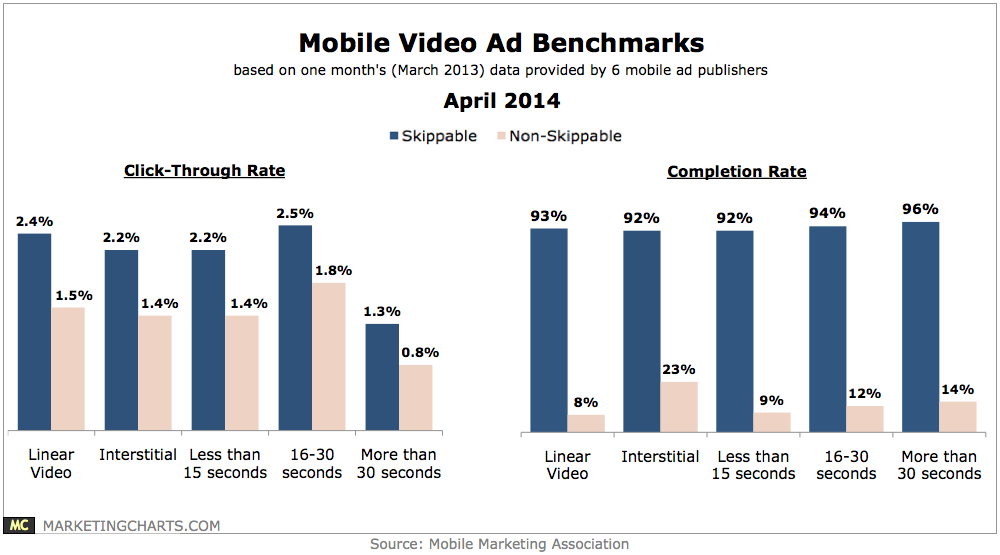
Completion rates for non-skippable video ads topped 90% for each of the formats measured – linear video (93%); interstitial (92%); and value exchange (97%).
Read MoreOnline Display Ad Benchmarks By Region in 2013 [CHART]
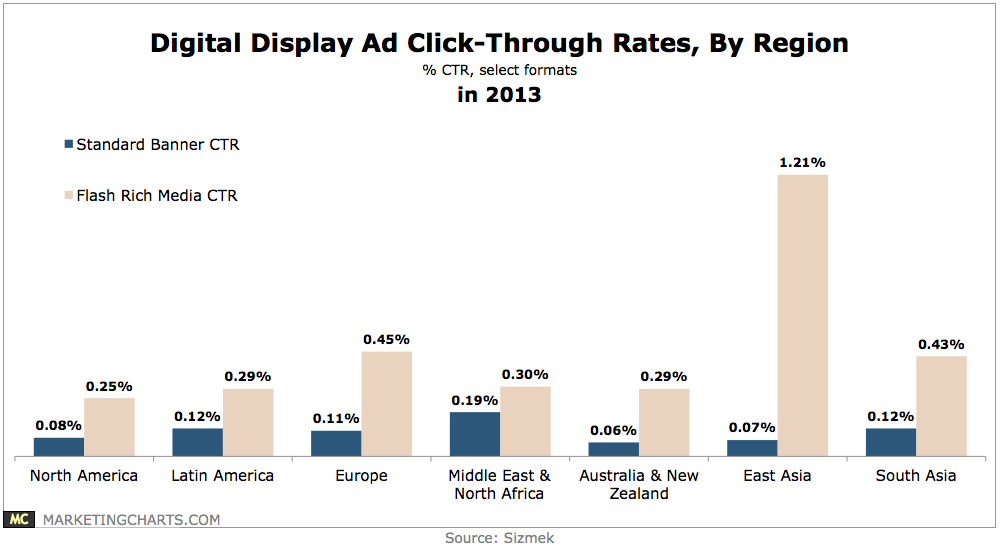
In North America, the average click-through rate (CTR) for standard banners slipped from 0.1% to 0.08%, while flash rich media CTRs jumped from 0.14% to 0.25%.
Read MoreAverage Viewability Rates For Video Ads In North America, January 2014 [CHART]
Video ad management and ad-serving platform Vindico found that between September 2013 and December 2013, just 44% of ads served via its Adtricity platform were in-view.
Read MoreTwitter Ads Outperform Facebook Ads [VIDEO]
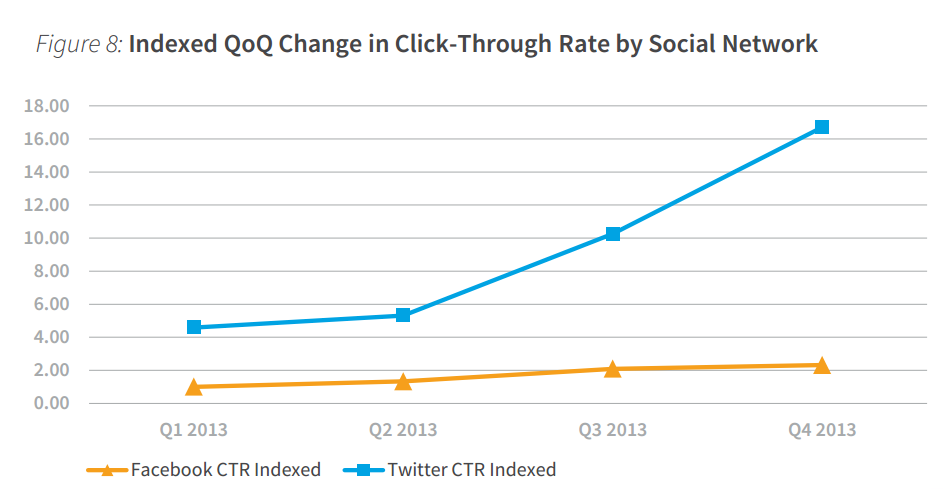
Facebook impressions exceed those of Twitter by so much that Facebook consistently delivers more clicks despite offering a much lower CTR on average.
Read MoreGlobal Paid Search Metrics By Region, Q4 2013 [TABLE]
Clicks for paid search increased 12.3% year over year worldwide, although impressions had dropped by just over 10%.
Read MoreUS Mobile Search Advertising Growth By Device, Q4 2013 [CHART]
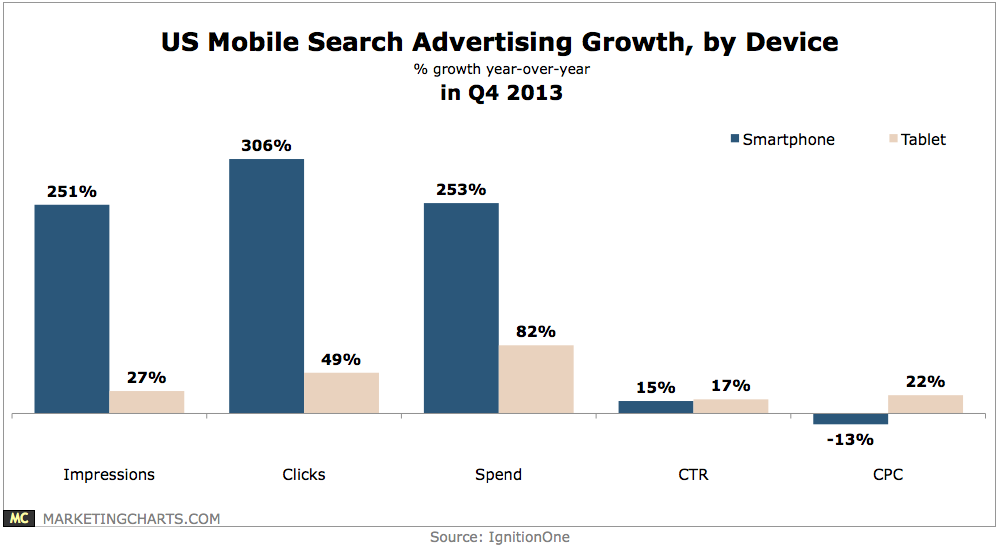
Search ad spending on smartphones soared by 253% year-over-year, while spending on tablets grew by a relatively smaller 82%, as advertisers’ targeting options were limited by Enhanced Campaigns.
Read MoreOnline Video Ad View Share By Device & Content Duration, Q3 2013 [CHART]
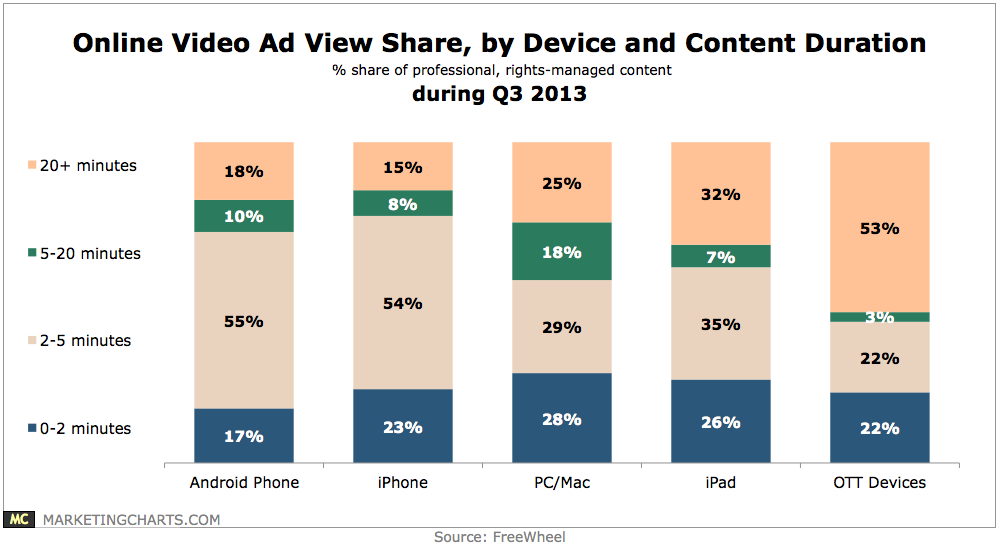
During Q3, 72% of ad views on Android phones were derived from content less than 5 minutes in length, with the corresponding figure at 77% for iPhone users.
Read MoreLong-Form Video Ad Loads & Completion Rates, Q3 2012 – Q3 2013 [CHART]
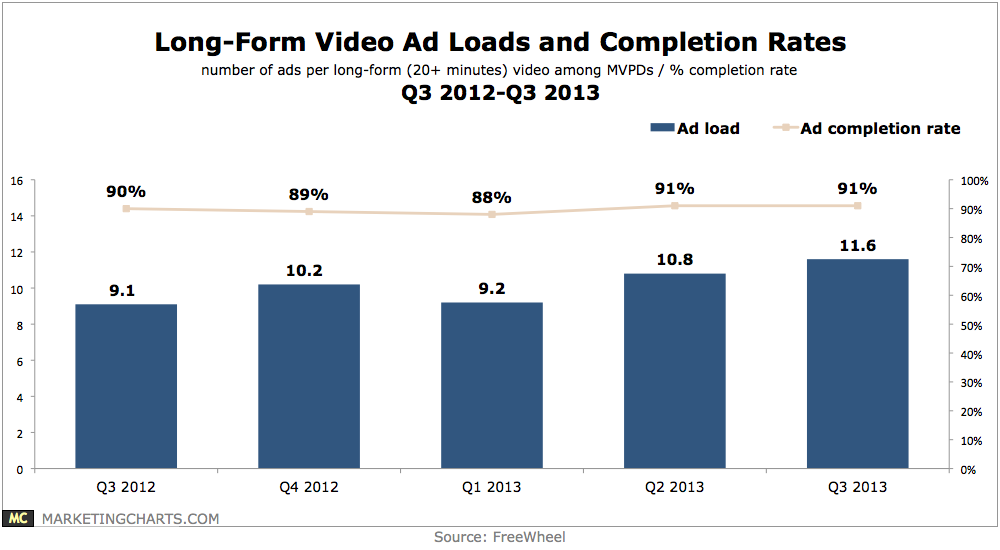
During Q3, FreeWheel says that the typical long-form (20+ minutes) video view carried 11.6 ads, up from 9.1 on average during the corresponding period last year.
Read More