Website Marketing
Understanding Of Online Customer's Experience, June 2013 [CHART]
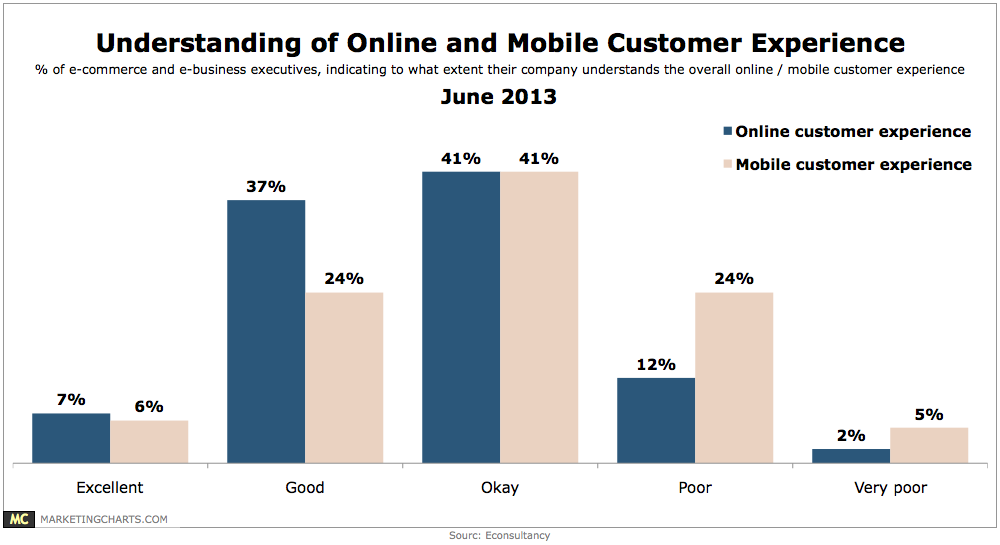
44% of respondents rated their company’s understanding of the online customer experience as either excellent (7%) or good (37%).
Read MoreBest Sources For Marketing & Advertising, June 2013 [CHART]
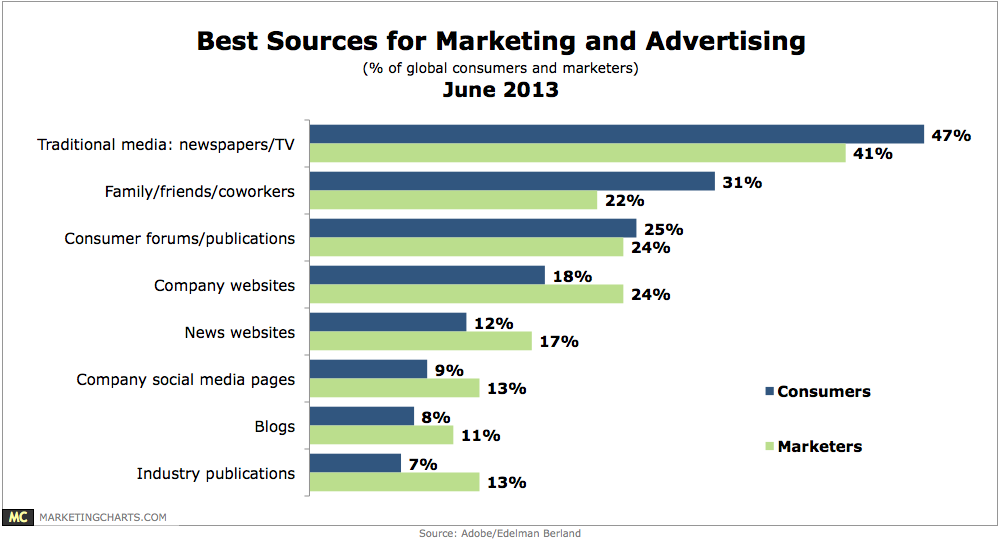
Consumers were more likely than marketers to choose traditional media sources such as newspapers and TV as best for advertising (47% vs. 41%), and also more likely to see their family, friends and co-workers as influential (31% vs. 22%).
Read MoreTablet vs. Smart Phone Website Visits For Select Industries, January 2013 [CHART]
Travel not only had the highest percentage of internet traffic coming from tablets at 11.2%, but it was also the only industry studied that actually saw more tablet traffic than smart phone traffic.
Read MoreAverage Global Hotel Website Pageviews/Visit by Device, Q4 2012 [CHART]
Tablet users spent much more time on hotel websites, viewing an average of 4.9 pages per visit in Q4 2012, approximately the same as PC users.
Read MoreThe History Of Public Relations [INFOGRAPHIC]
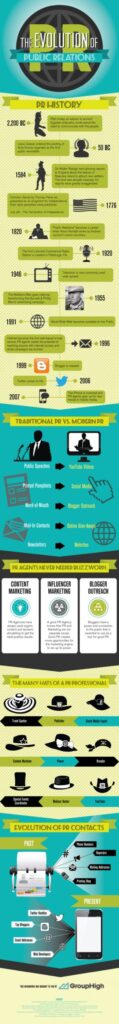
This infographic about the history of public relations was created by GroupHigh.
Read MoreDemographics Of Auto Website Visitors, June 2012 [CHART]
The 18-to-34-year-old segment still makes up a large portion of digital automotive media consumption.
Read MoreAffluent Shoppers' Preferred Purchase Channels By Demographic, April 2013 [CHART]
The store still won out as the most common place to make a purchase among affluent consumers, cited by 78% of respondents.
Read MoreSmart Phone Activity Share By OS, May 2013 [CHART]
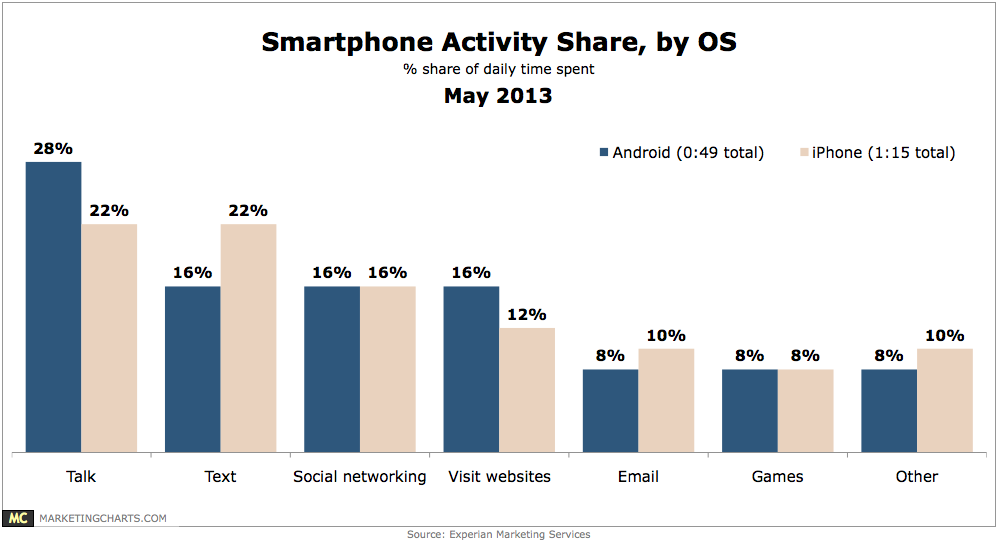
Americans spend about an hour each day on their smart phones (58 minutes to be exact).
Read MoreResponses To Out-Of-Home Advertising, May 2013 [TABLE]
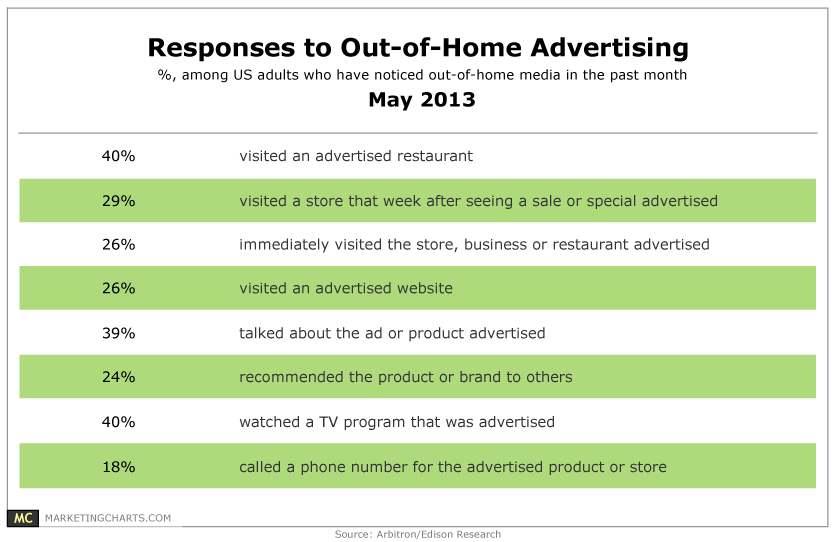
3 in 4 American adults report having noticed billboard (static or digital), transit or street-level advertising in the past month.
Read MoreShare Of E-Commerce Site Traffic By Source, Q4 2011-Q4 2012 [CHART]
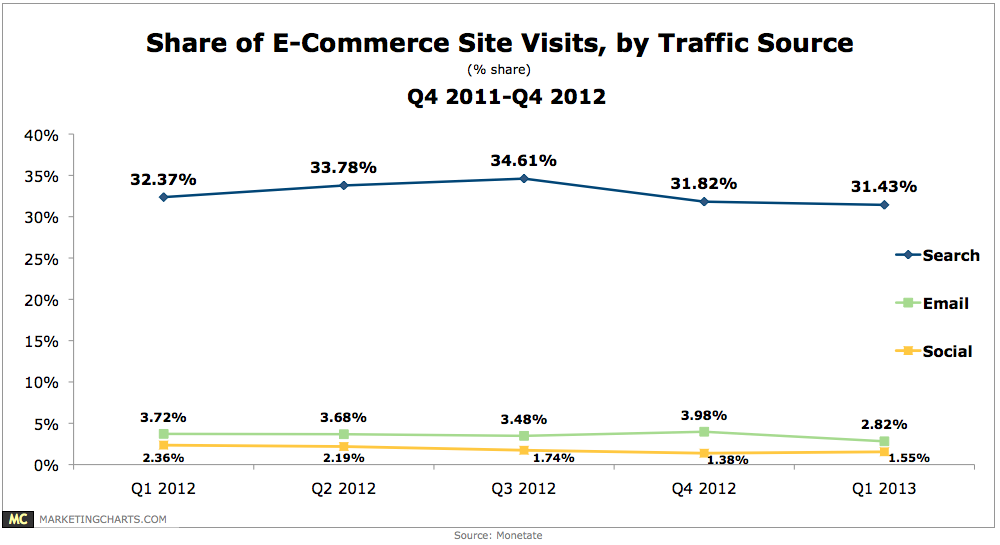
Compared to email (2.82%) and social media (1.55%), search (31.43%) is easily the primary driver of direct e-commerce traffic.
Read More