Web Development
Top Places New Vehicle Buyers Look For Product Information, August 2012 [CHART]
74% of US new-vehicle buyers surveyed used dealership websites, via desktop, mobile phone or tablet, during the buying process.
Read More
Google's Universal Search [INFOGRAPHIC]
This infographic from Search Metrics illustrates their study of Google’s Universal Search results.
Read MoreRetail Website Load Times, March 2013 [CHART]
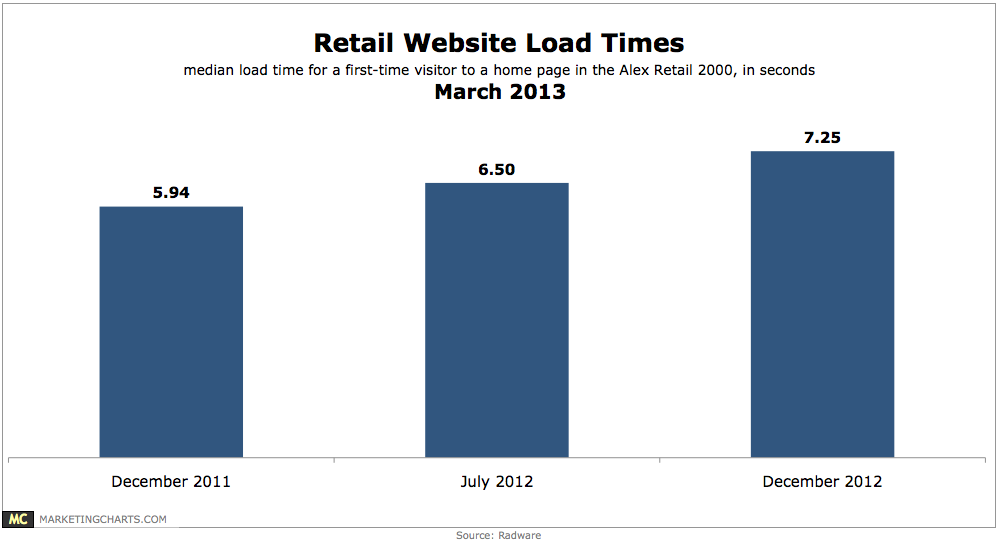
Between December 2011 and 2012, the median load time for home pages of top North American retail sites (the Alexa Retail 2000) slowed 22% from 5.94 to 7.25 seconds.
Read MoreTablet Traffic To US Websites Of Select Industries, January 2013 [CHART]
The top-performing retailer site studied got 13% of internet traffic from tablets.
Read MoreUS Smart Phone Website Traffic To Select Industry Websites, January 2013 [CHART]
The top-performing site that got the greatest share of traffic from smart phones was in the media and entertainment category.
Read MoreTime Spent On US Websites By Select Industries, January 2013 [CHART]
The top-performing media and entertainment site kept users on the site for about 12 minutes per visit.
Read MoreWhere People Use Mobile Travel Sites & Apps, March 2013 [CHART]
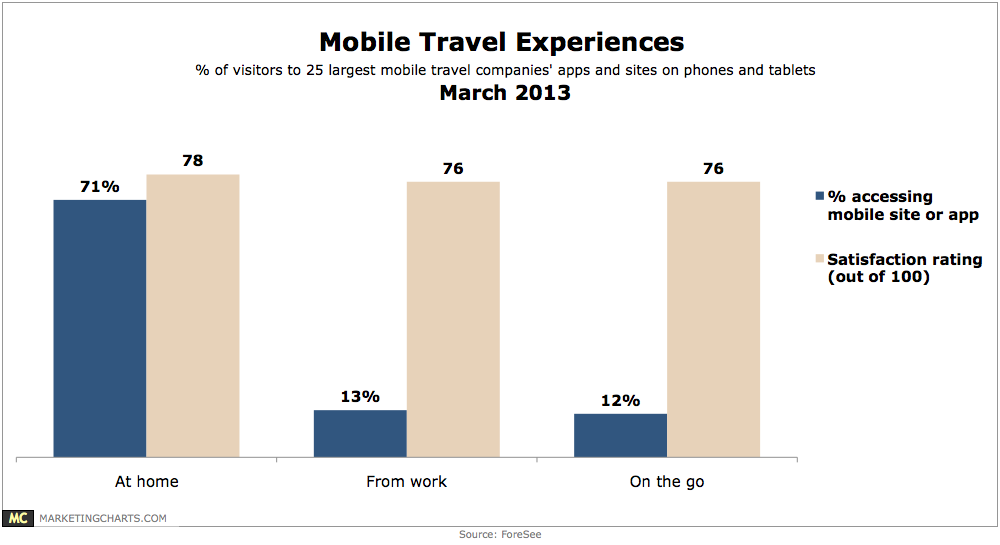
71% of consumers accessed travel companies mobile websites or apps from home, compared to 13% who accessed from work and just 12% who visited them on-the-go.
Read MoreMobile Website vs. App Traffic, March 2011-March 2013 [CHART]
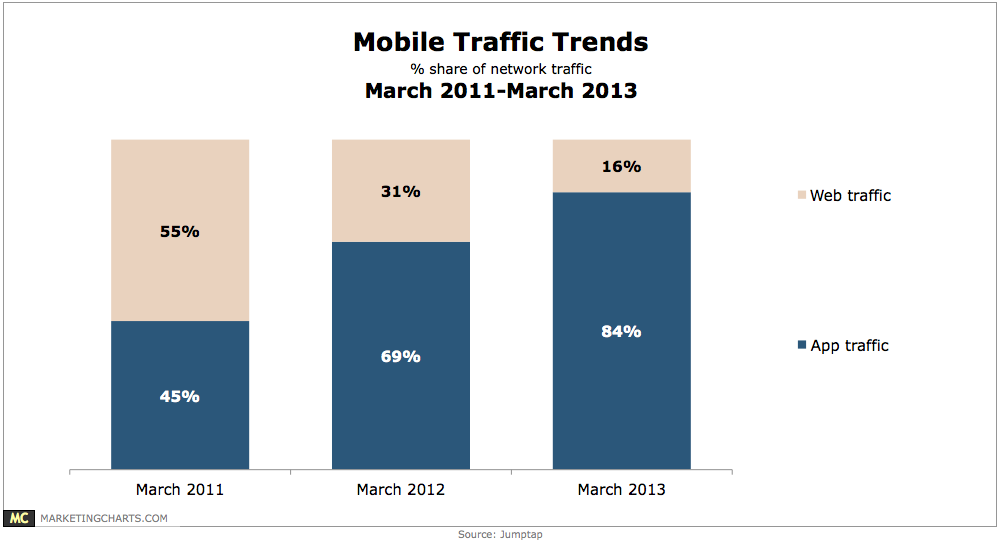
85% of mobile application users prefer them to the mobile web, primarily as a result of convenience and speed.
Read MoreMillennials' Cross-Channel Behavior, March 2013 [CHART]
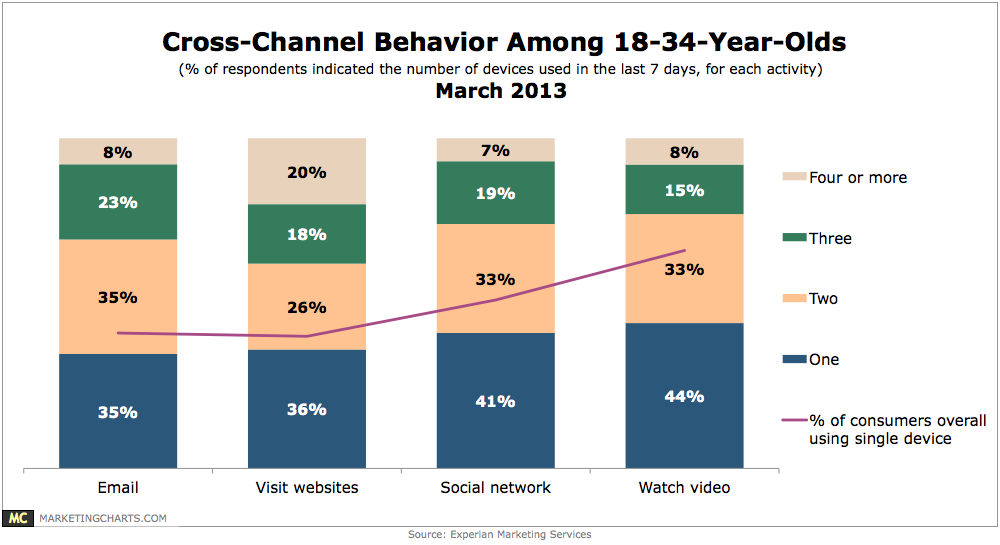
59% of consumers surveyed used more than one device to email in the 7 days prior to the survey and 60% used multiple devices to visit websites.
Read More