Web Development
Marketers Use Of Video, 2012 vs 2013 [CHART]
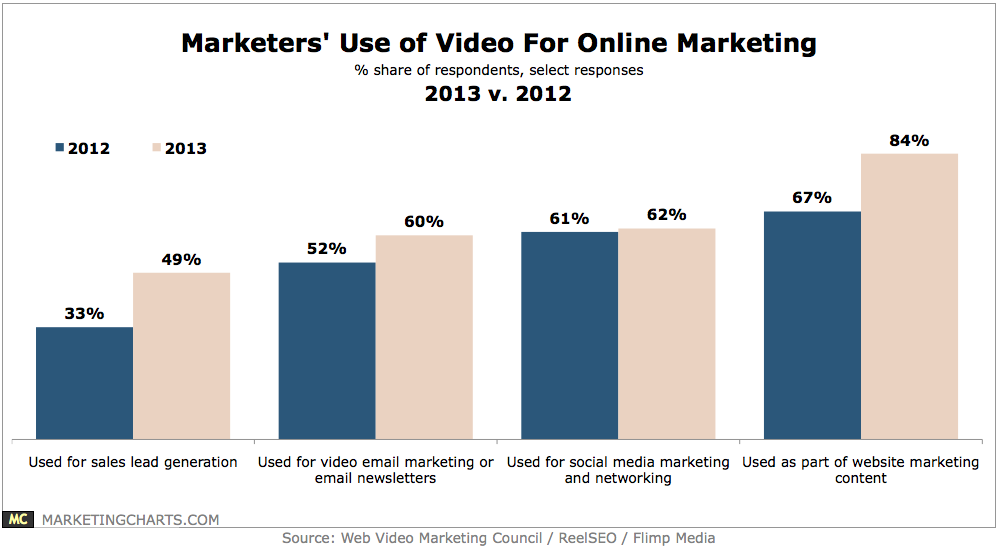
While survey respondents most commonly report using online video as part of their website marketing content (83.9%) and for YouTube marketing (65.2%), an increasing share say they’re using it for video email marketing or email newsletters.
Read MoreConsumer Perceptions Of Online Marketing Channels' Value, October 2013 [CHART]
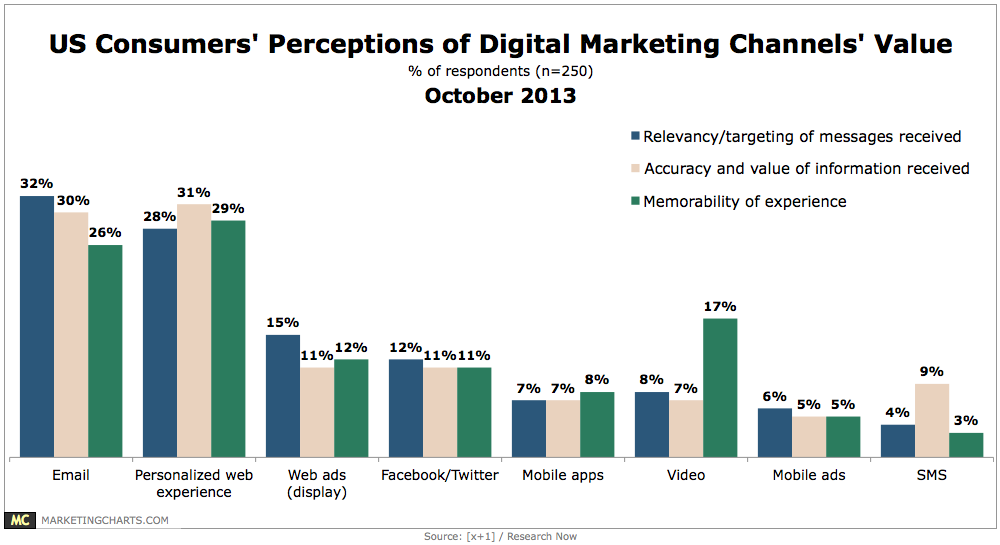
79% pointed to web personalization as worth the effort.
Read MoreB2B Content Marketing By Tactic [CHART]
Compared to last year, the average number of tactics used has risen from 12 to 13.
Read MoreB2B Content Marketing [INFOGRAPHIC]
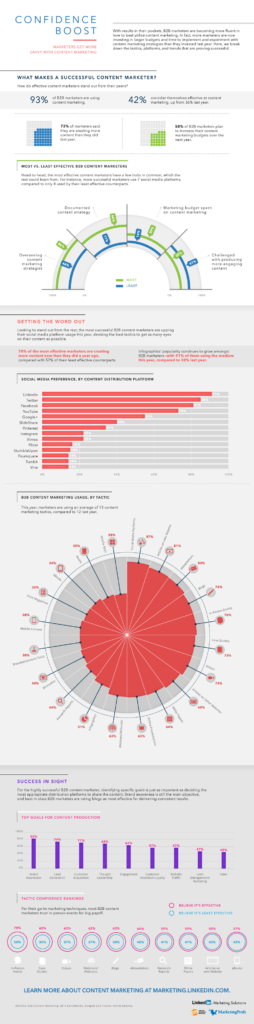
This infographic from LinkedIn illustrate’s B2B content marketing efforts.
Read MoreReasons People Would Shop On A CPG Brand Site vs Online Retailer, July 2013 [CHART]
Nearly 3/4ths said they would shop on a brand site over an online retailer like Amazon because it offers exclusive products.
Read MoreOnline Channels That Drive The Most CPG Revenues, July 2013 [CHART]
39% of CPG executives believed direct-to-consumer channels were driving the most digital revenues for their companies.
Read MoreBuyers' Expectations & Experiences When Inquiring Online, October 2013 [CHART]
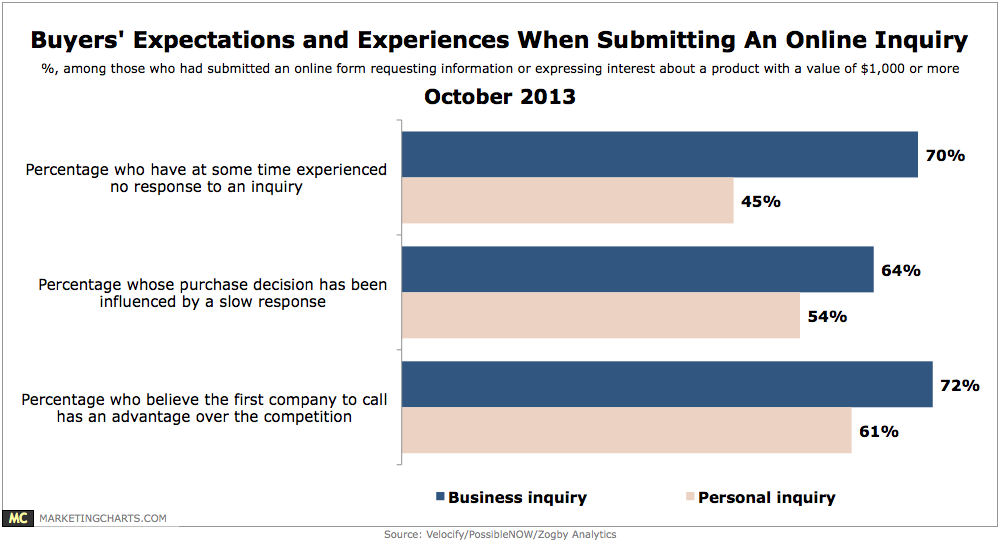
When inquiring about a product or service, only 6% of all potential buyers submit online inquiries to a single company, with a significant majority submitting inquiries to 3 or more companies.
Read MoreFrequency With Which US Consumers Visit Their Bank's Website vs. Brand Location, July 2013 [CHART]
Nearly three-quarters of US consumers who owned at least one computer, tablet and smart phone visited a banking website or mobile site more than five times per month.
Read MoreSocial Media Traffic Referral Trends, September 2012-September 2013 [CHART]
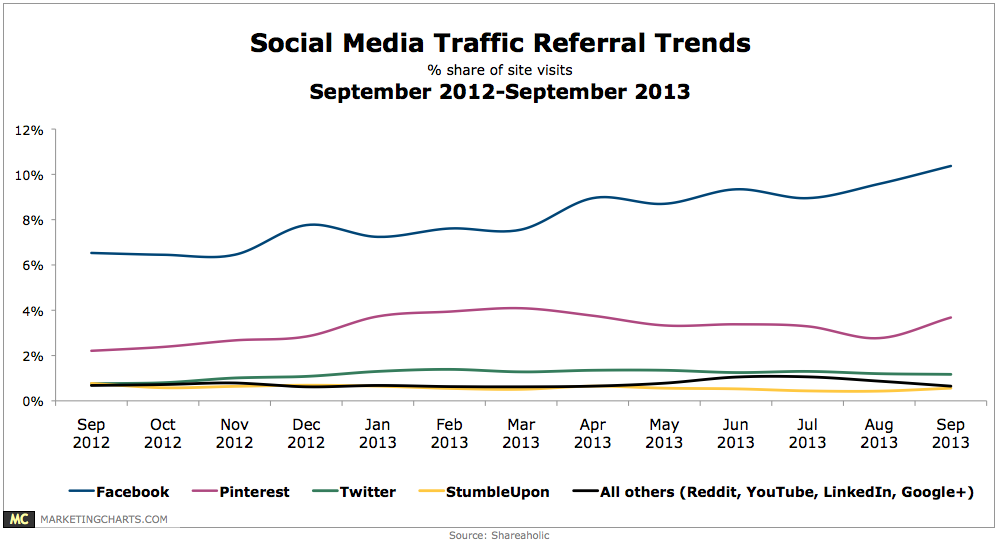
Facebook is easily the leading social referrer of traffic, confirms a new report from Shareaholic, which analyzed 13 months of data collected from 200,000 publishers reaching more than 250 million unique monthly visitors.
Read MoreTop Retail Website Load Times, October 2013 [CHART]
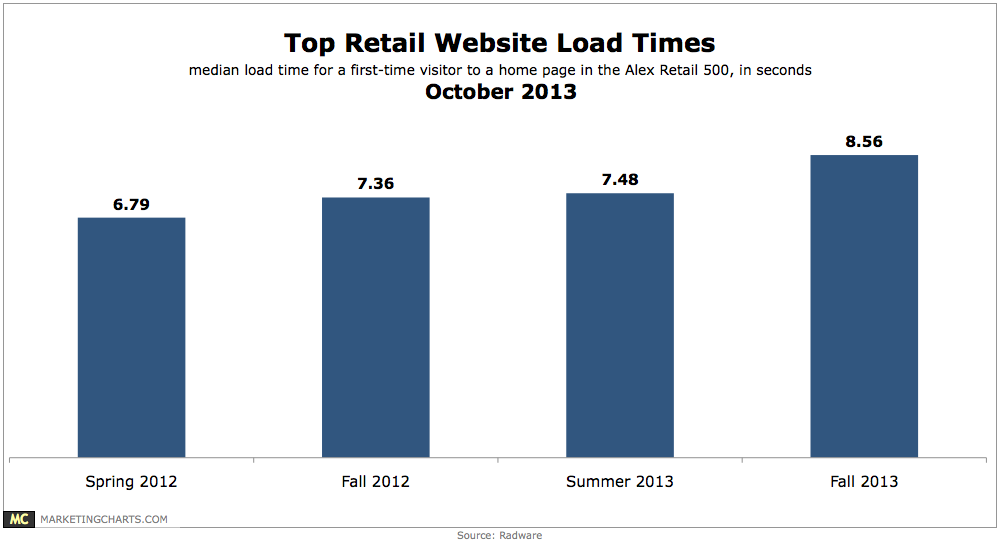
The median load time for home pages of the top 500 US retail websites (as ranked by Alexa) keeps slowing down, clocked at 8.56 seconds during the Fall, up from 7.48 seconds in the Summer and from 7.36 seconds in the Fall of last year.
Read More