Visual Communications
Snapchat Users By Age, 2013 vs 2015 [CHART]
Snapchat captured the interest of 36% of marketers surveyed. Each of the top three platforms named was a visual social network.
Read MorePlatforms To Which Marketers Would Allocate Budgets, September 2015 [CHART]
Several fast-growing social media services began offering themselves as platforms for advertisers this year.
Read MoreTypes Of Visual Content Marketers Are Most Likely To Use, September 2015 [CHART]
Custom video and photography were the top types of visual content that respondents planned to integrate into marketing programs over the next six months to one year.
Read MoreMarketers' Definition Of The Visual Web, September 2015 [CHART]
The visual web is many things to many people—and marketers.
Read MoreCollege Students' Social Media Time By Social Network, May 2015 [TABLE]
May 2015 polling by Fluent among college students ages 17 to 25 found that the vast majority kept their social media activities limited to less than six hours daily.
Read MoreCreating Shareable Content [INFOGRAPHIC]
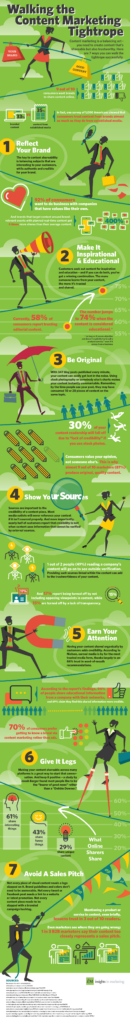
This infographic from Insights In Marketing illustrates 7 steps for creating trustworthy, shareable content.
Read MoreValue Of Visual Communications, August 2015 [CHART]
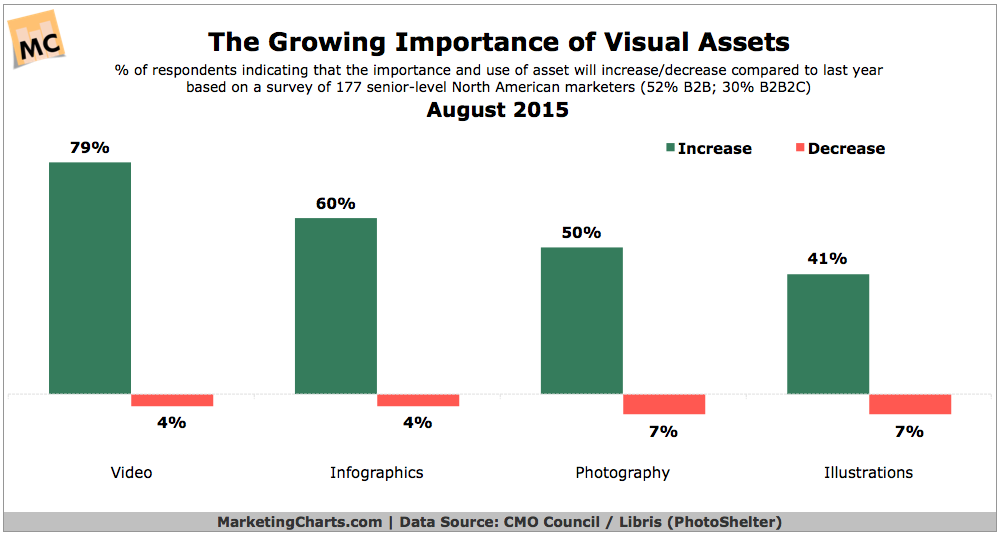
Almost two-thirds of senior marketers in North America feel that visual assets (photos, videos, illustrations and infographics) are core to their brand story communications.
Read MoreTrust In Branded Content By Channel, July 2015 [CHART]
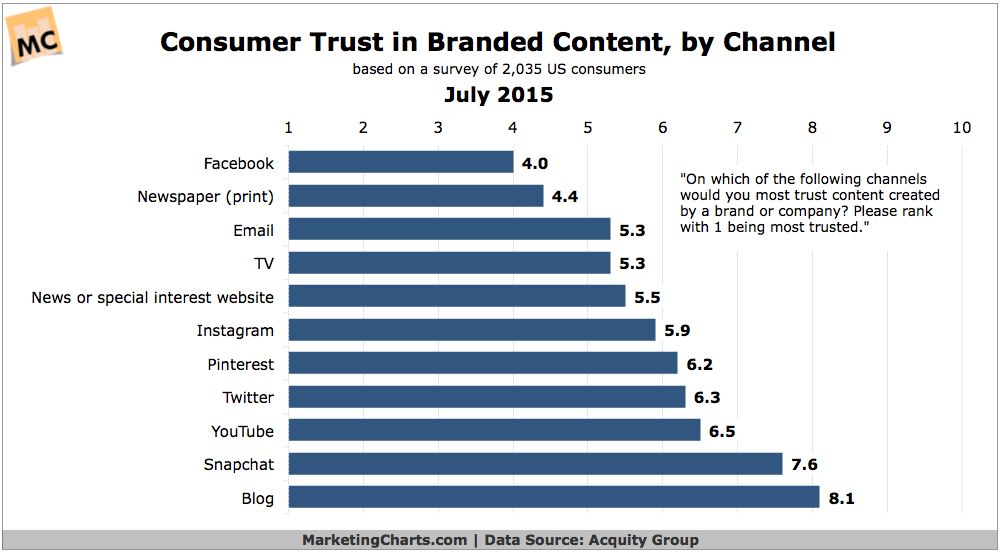
Consumers are more likely to trust brand content found in a print newspaper and on TV than in a variety of social platforms.
Read MoreOnline Activities Parents Consider Educational For Their Children, August 2015 [TABLE]
90% of parents also listed digital games with educational purposes as a useful pursuit, along with visiting educational websites and reading books.
Read MoreInstagram Hashtags [INFOGRAPHIC]
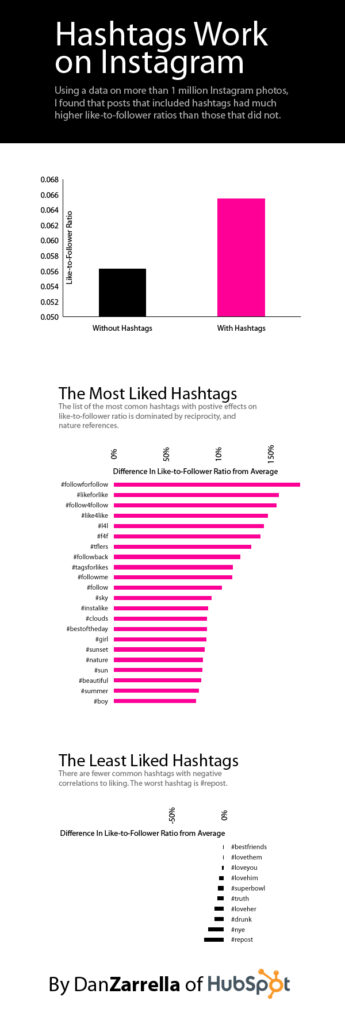
This infographic by Dan Zarrella illustrates the effect of hashtag use on Instagram.
Read More