Video
Top Forces Disrupting The Marketing Industry, October 2015 [CHART]
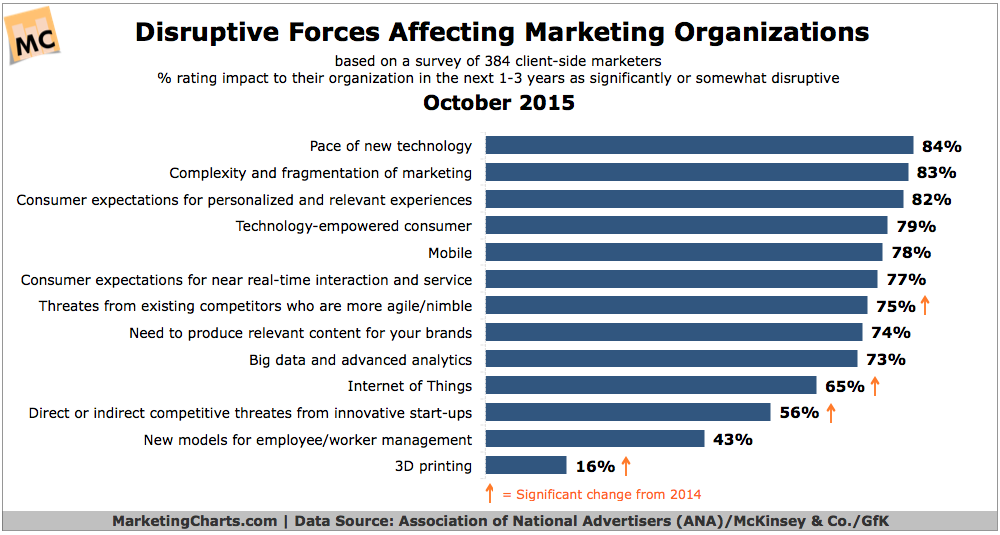
Topping the list, as it did in last year’s report, was the pace of new technology, cited as being significantly or somewhat disruptive by 84% of respondents.
Read MoreMost Popular Social Sites For Teens, October 2015 [CHART]
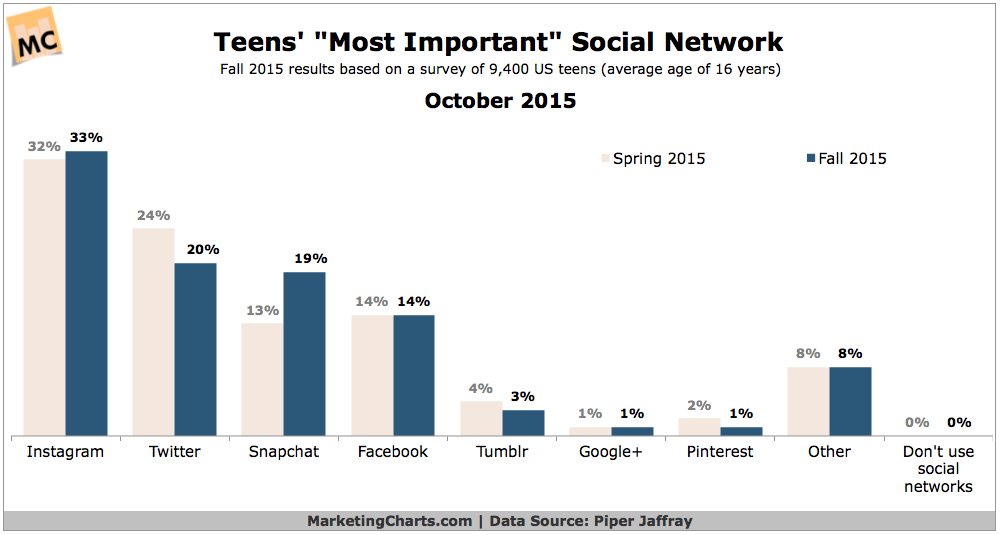
Instagram continues to be at the top of the heap when it comes to teens’ most important social networks.
Read MoreMost Effective Types Of Content For Social Media, October 2015 [CHART]
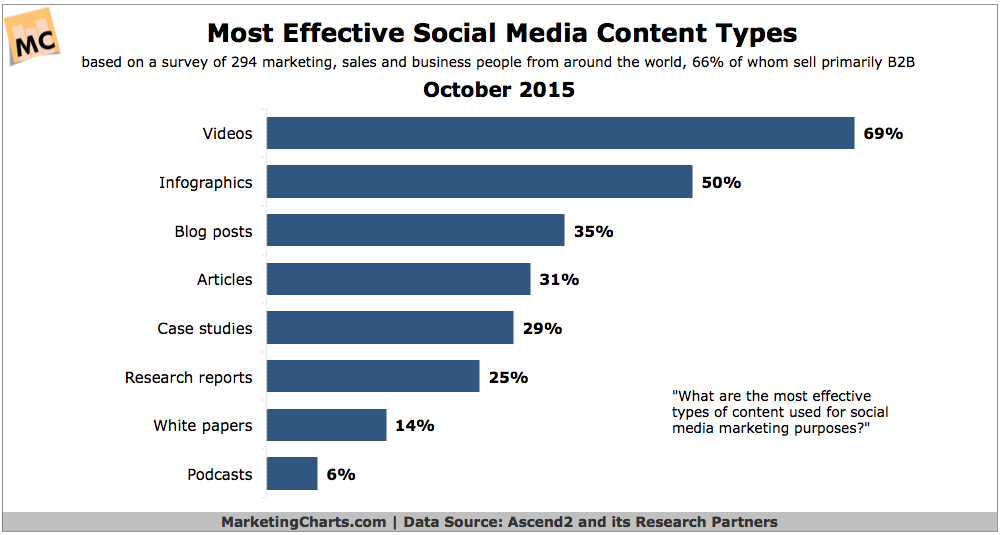
Visual content such as videos and infographics are considered effective by more marketers than blog posts and articles.
Read MoreGlobal Email Deliverability Rates By Industry, October 2015 [CHART]
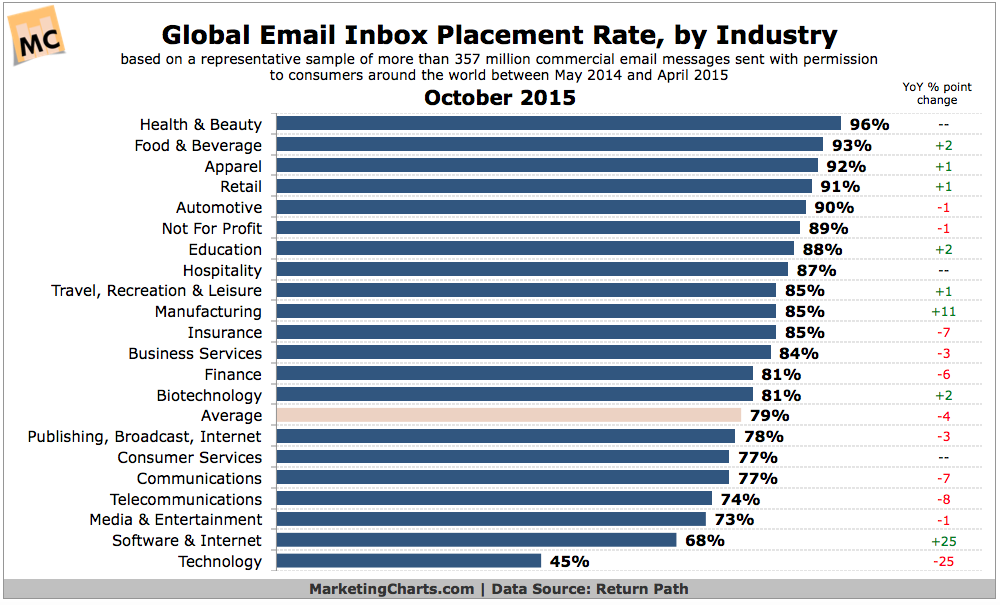
Some 21% of permission emails from legitimate senders around the world failed to reach the inbox during the year-long period from May 2014 to April 2015.
Read MoreBuyer's Journey Budgeting [INFOGRAPHIC]
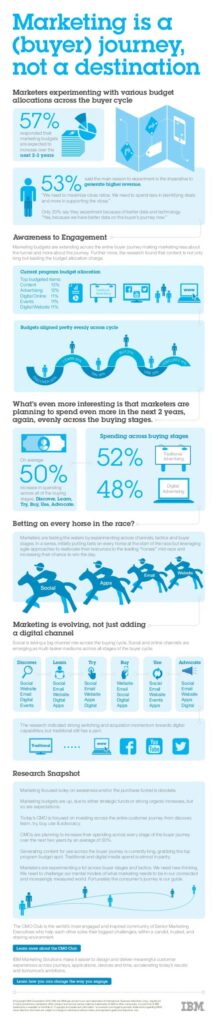
This buyer’s journey budgeting infographic from IBM and The CMO Club illustrates that content generation is the biggest expenditure for the CMOs surveyed.
Read MoreSocial Media Adoption, 2005-2015 [CHART]
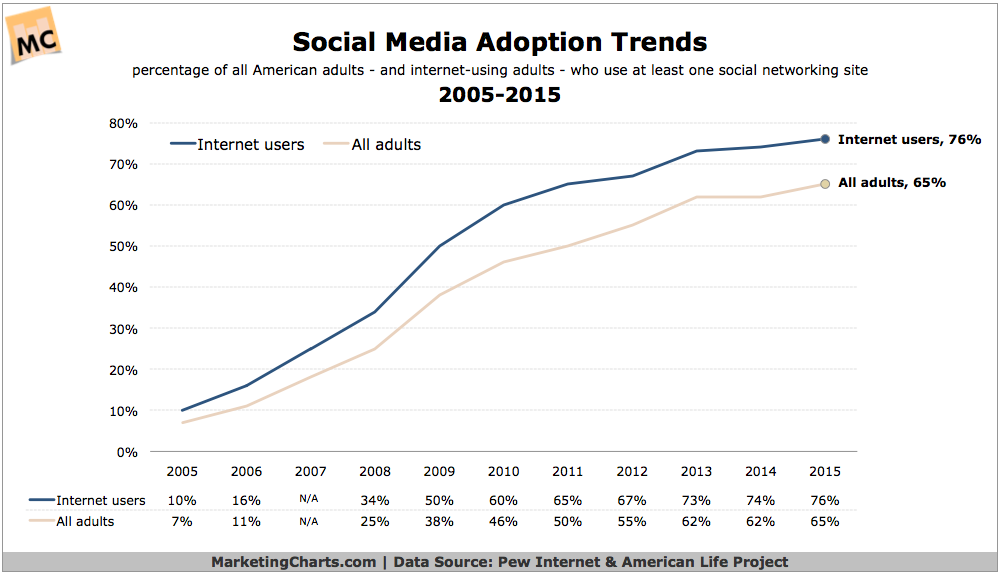
76% of Internet-using adults – and 66% of American adults overall – use at least one social networking site.
Read MoreConsumer Willingness To Pay More For Sustainable Products, October 2015 [CHART]
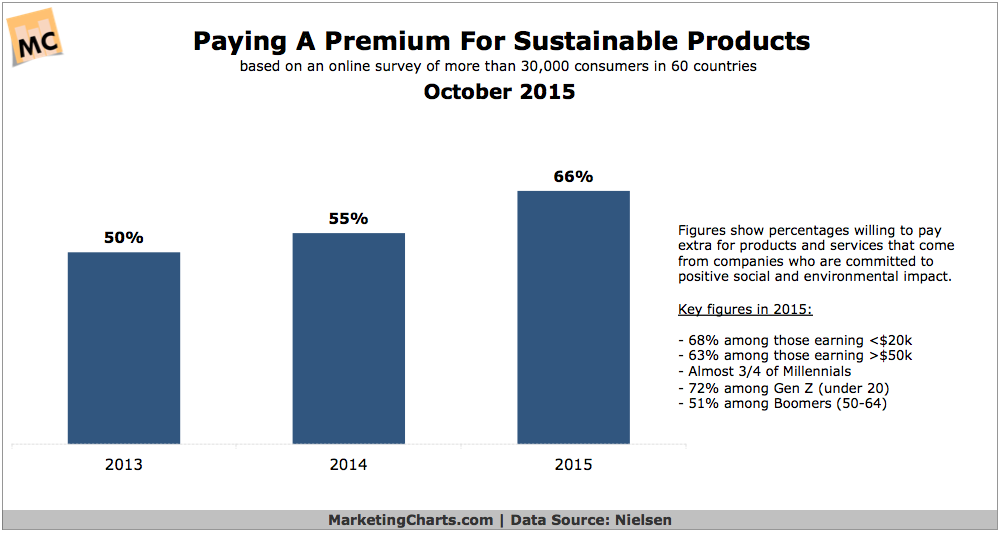
Consumer inclination to pay extra for sustainable products is on the rise. –
Read MoreTop Elements For Mobile Retail Experience, October 2015 [CHART]
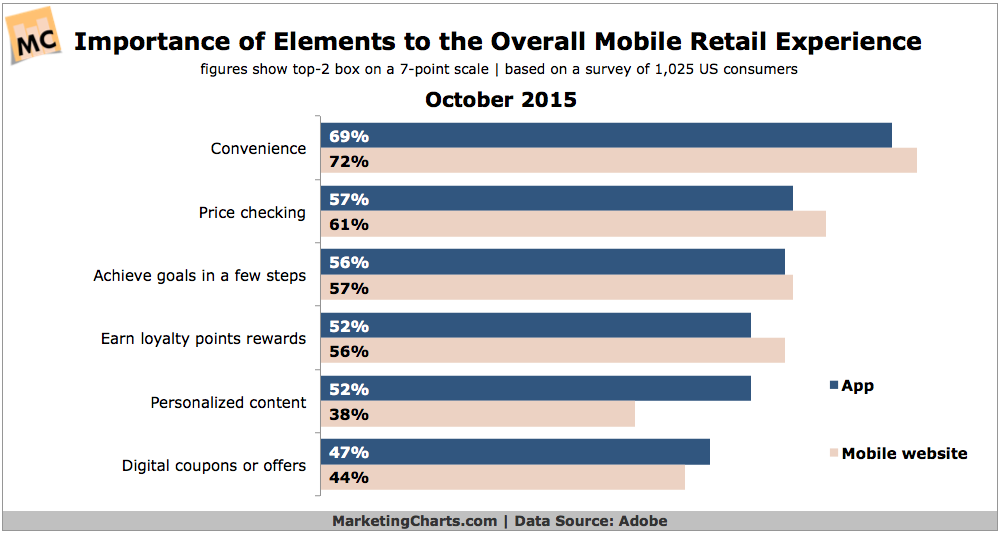
Convenience is the most important element of the mobile retail experience, whether that experience is on the mobile web or in mobile apps.
Read More2015 Brands With Most Loyal Customers [TABLE]
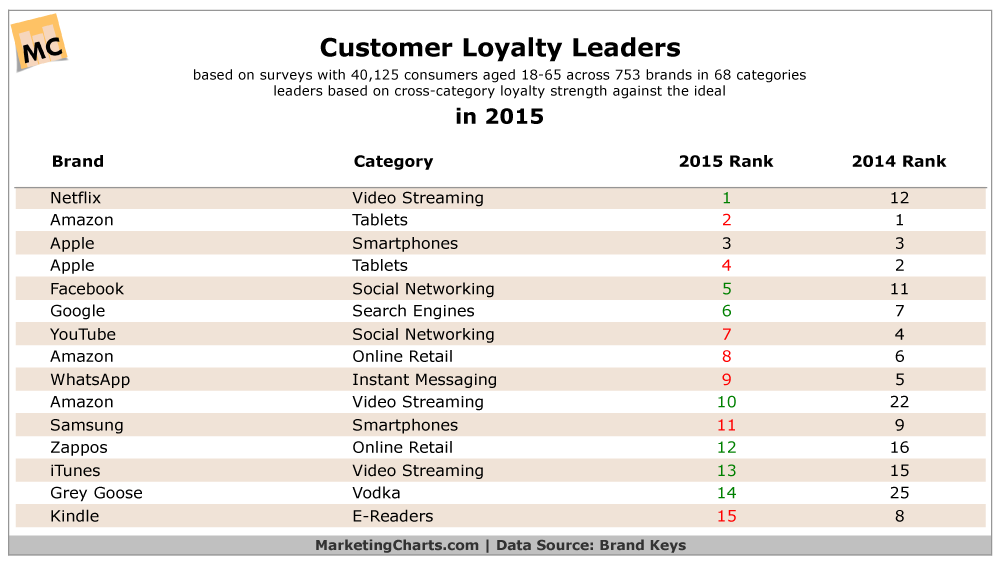
Netflix is this year’s brand loyalty leader, rising 11 spots from last year’s results to take the mantle from Amazon.
Read MoreGoogle+ Usage [INFOGRAPHIC]
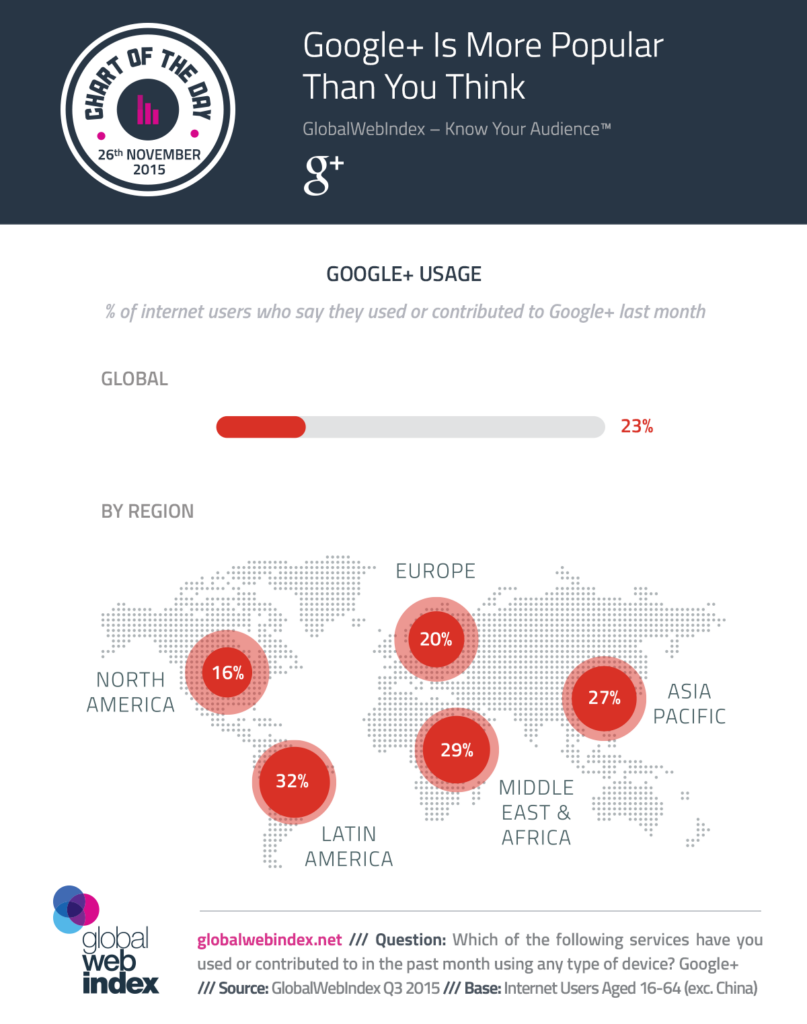
Despite having stripped back some of its core features recently, 1 in 4 Internet users still use Google+ each month (rising higher in some fast-growth markets).
Read More