Video
Instagram Brand Post Interaction Rates, 2015 [CHART]
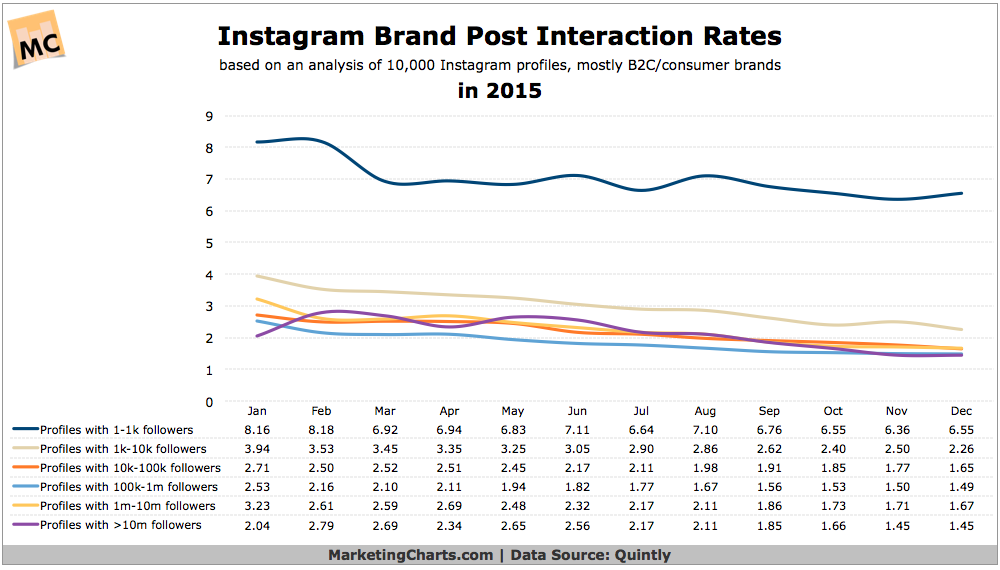
While brands gradually increased their daily number of Instagram posts in 2015, their interaction rates declined from an average of 4.96 to 3.1.
Read MoreVirtual Reality Users By Device, 2016-2020 [CHART]
By the end of this year, there will be more than 6 million virtual reality users worldwide.
Read MoreAverage Total Shares Of Facebook Videos [CHART]
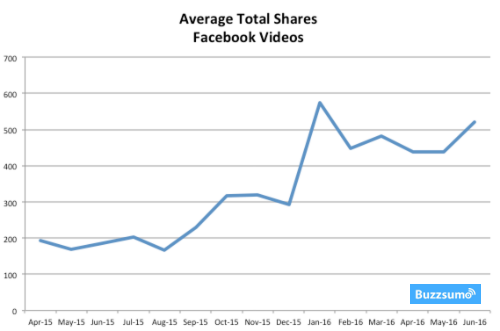
The one format that is driving significantly higher shares on Facebook is videos.
Read MoreDaily Time Spent On Facebook By Device, 2013-2018 [CHART]
This year, Americans will spend more than half of their social networking time on Facebook.
Read MoreHow Americans Celebrate Independence Day [INFOGRAPHIC]
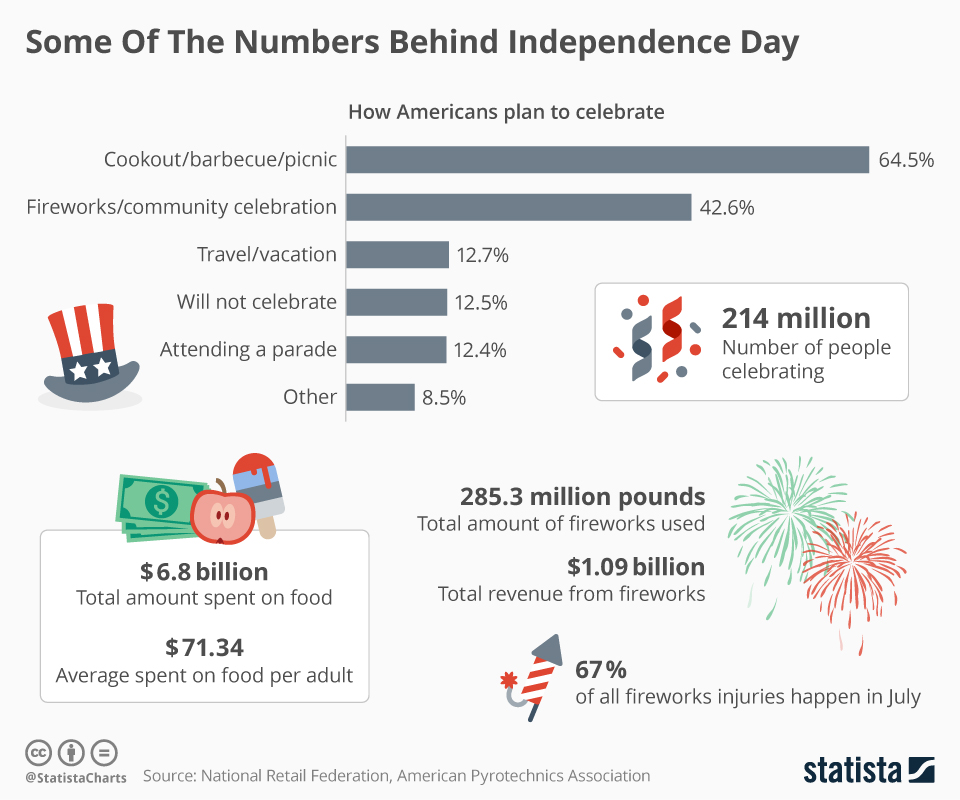
This infographic illustrates how Americans celebrate Independence Day, from eating to travel to entertainment.
Read MoreDesktop vs Mobile Email Click-To-Open Rates [CHART]
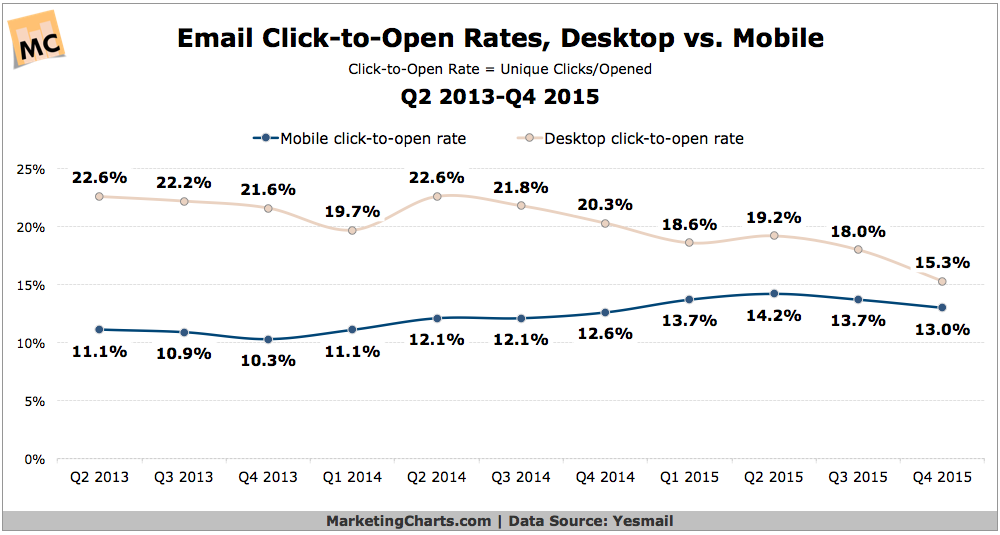
Email click-to-open rates on mobile devices are continuing to close the gap with desktop rates.
Read MoreTop Benefits Of Live Video-Streaming Events [CHART]
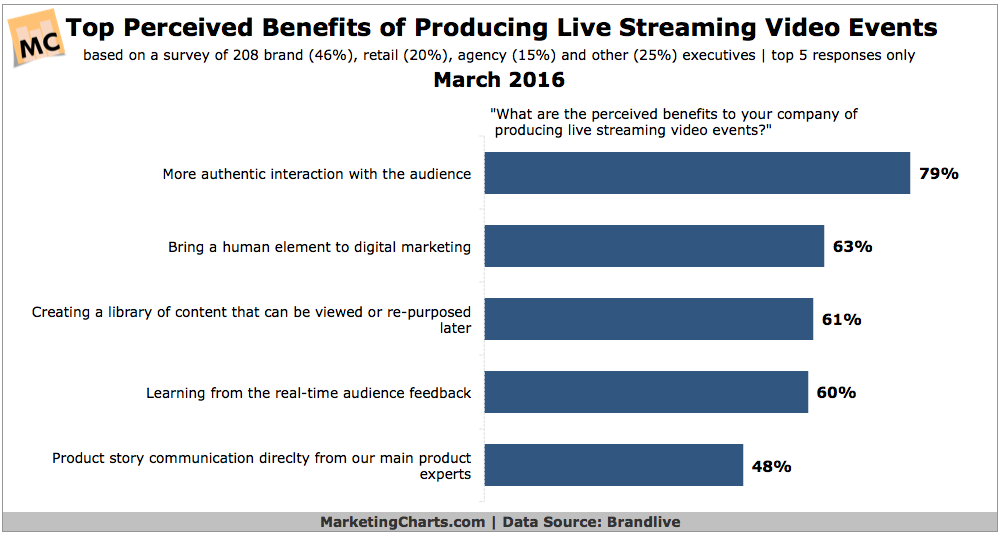
Communication and authenticity appear to be at the heart of live streaming video’s potential benefits to companies.
Read MoreMost Important Factors For B2B Marketers' Future Efforts [CHART]
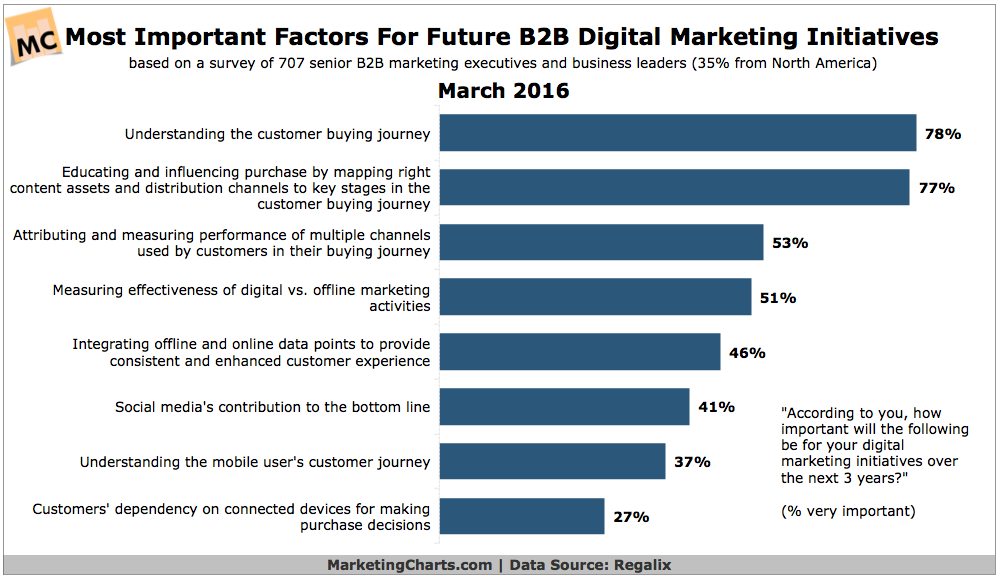
While the delivery of quality leads is marketers’ top objective, measuring and proving ROI is the biggest digital marketing challenge.
Read MoreKeyword Research [INFOGRAPHIC]
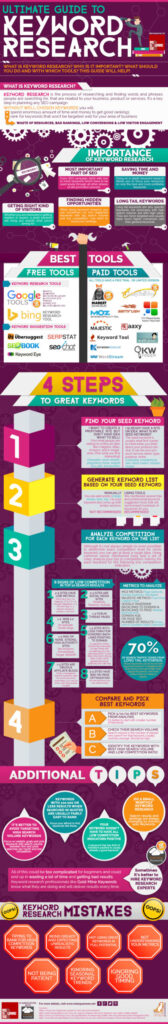
This infographic illustrates the complex practice that is keyword research and search engine optimization.
Read MoreRadio Listeners' Habits By Generation & Ethnicity [CHART]
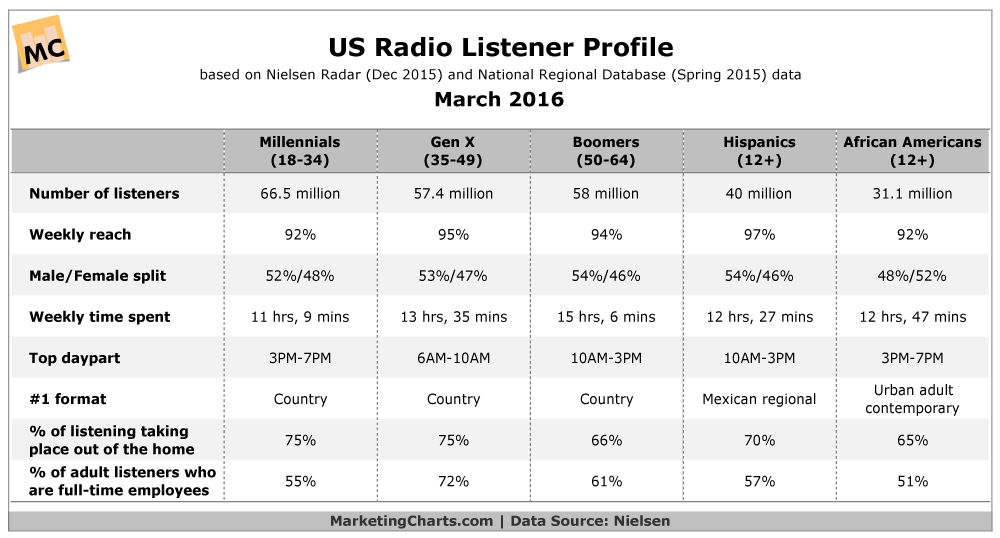
With 93% of US adults listening to radio on a weekly basis, radio is the leading reach platform.
Read More