Video
Why People Listen To Radio [CHART]
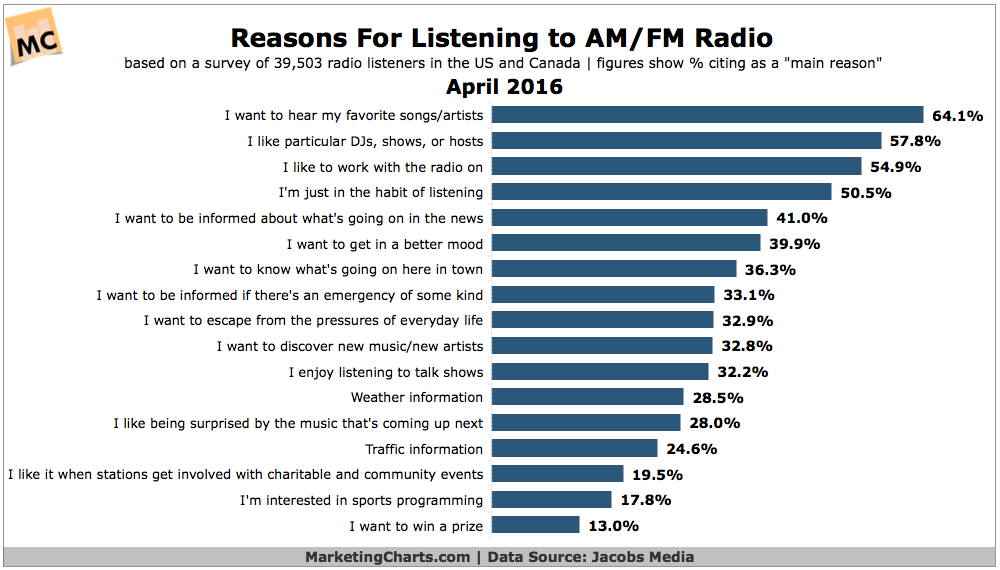
Almost 1 in 5 AM/FM radio listeners report spending more time listening to the radio this year than last, close to twice the proportion of listeners who are tuning in less.
Read MoreCreativity By State [MAP]
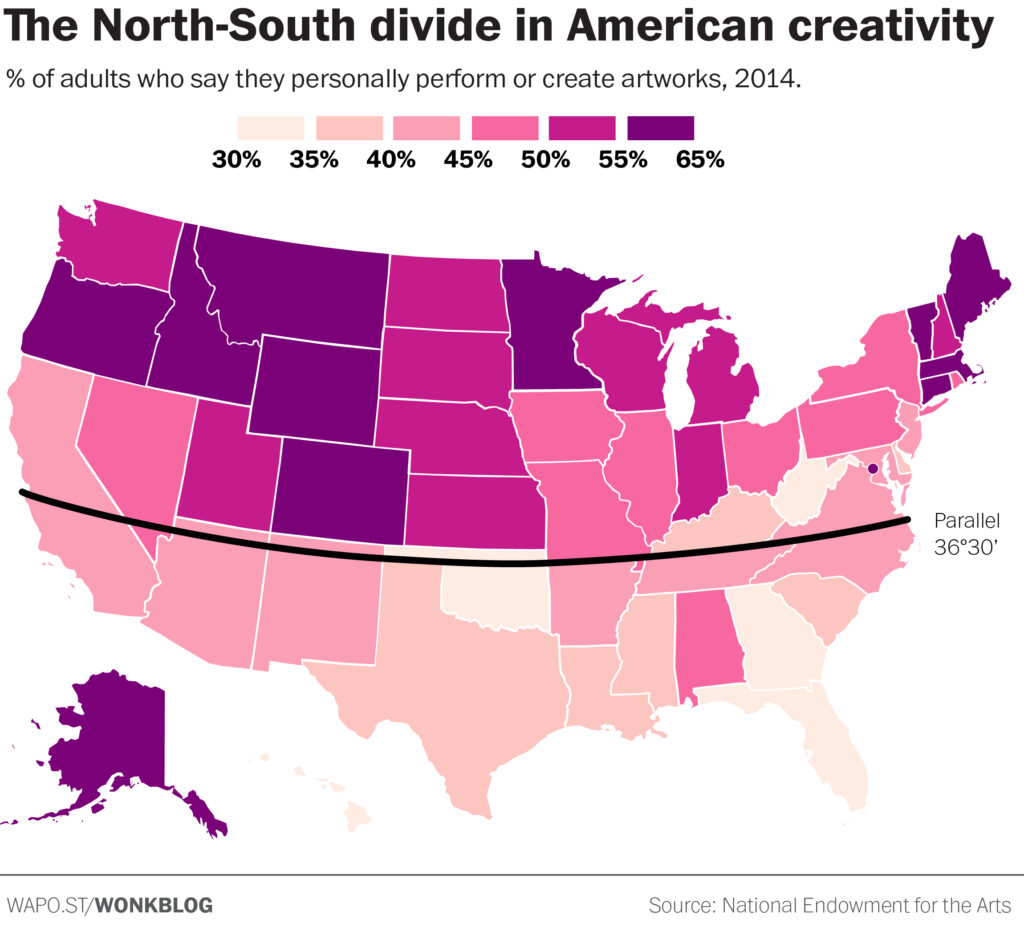
New data recently released by the National Endowment for the Arts suggests that there’s an awful lot of creativity happening far inland from America’s coastal tech and arts hubs.
Read MoreSources Of News, 2012-2016 [CHART]
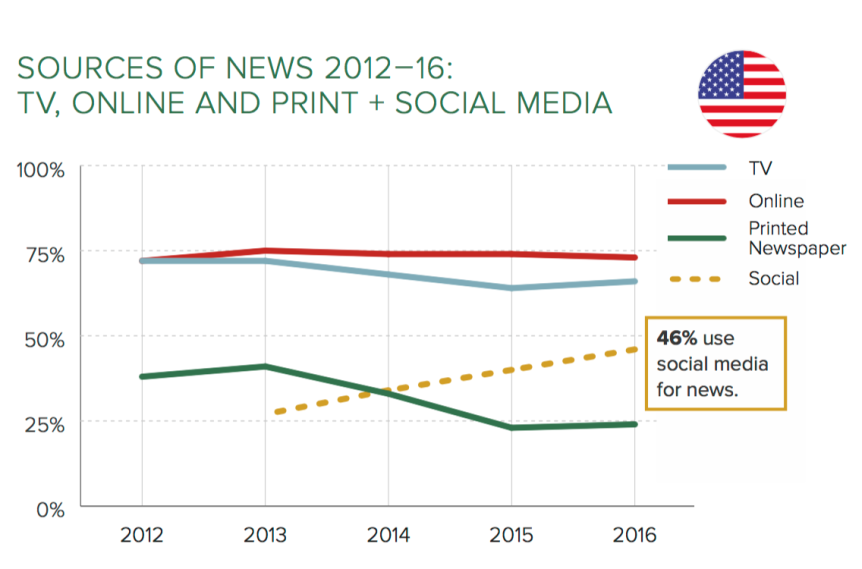
Since 2013, the number of people in the US who say they get their news from social media has doubled—46 percent now use social media for news.
Read MoreAverage Minutes Visitors Spent On News Sites, Mobile vs Desktop [CHART]
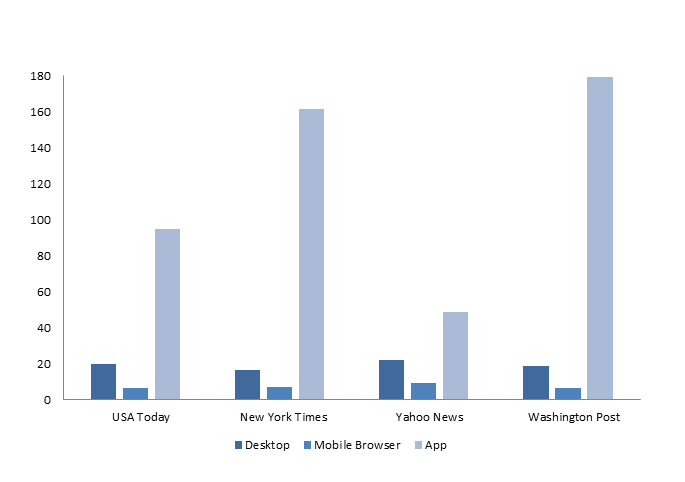
By 2020, two-thirds of all online activity is expected to take place on mobile devices.
Read MorePublic Relations Transformation [INFOGRAPHIC]
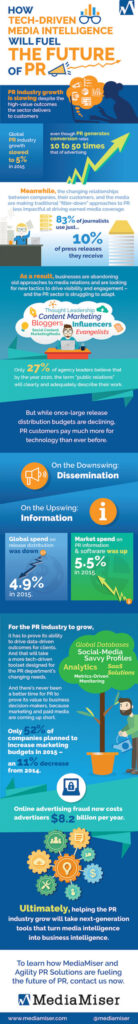
This infographic from MediaMiser highlights what the future of public relations will look like as technology transforms the industry.
Read MoreTop Amazon Search Engine Ranking Factors [CHART]
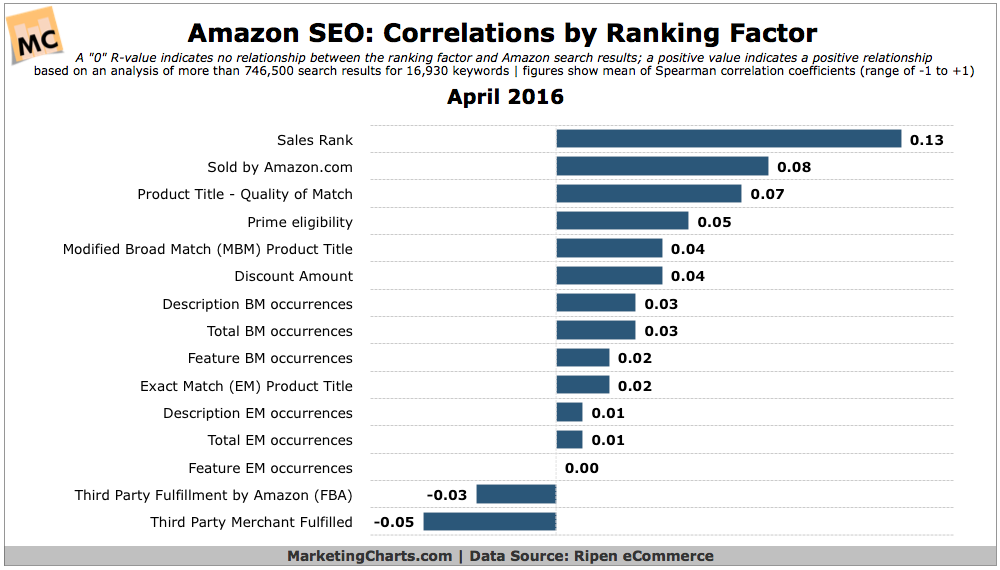
While no single factor has a very strong correlation with search rankings, Amazon’s sales rank has the highest correlation with search success on the platform.
Read MoreTime Spent Online By Content Type Or Channel [CHART]
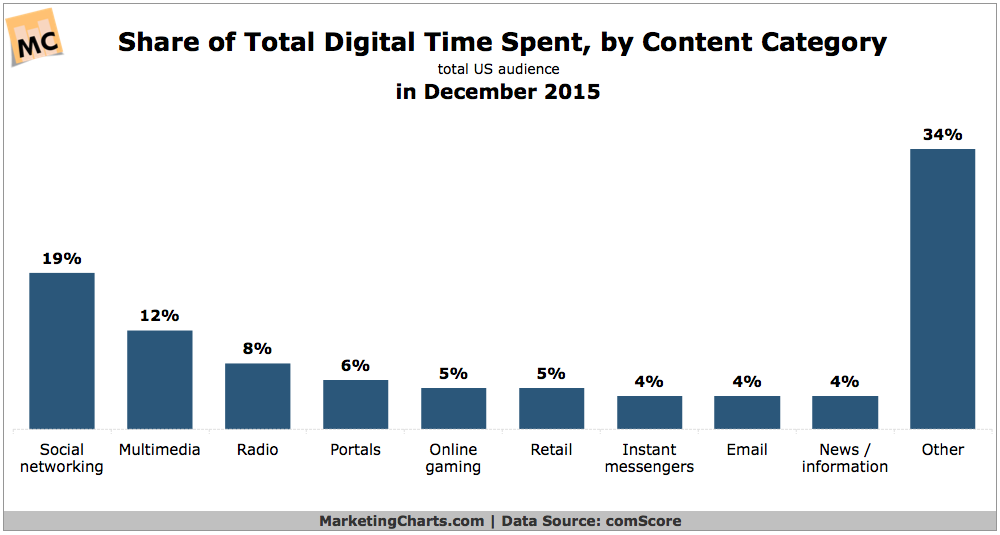
Social networking accounts for almost 1 in every 5 minutes spent online, according to a recent study from comScore.
Read MoreMost Popular Mobile App Types [CHART]
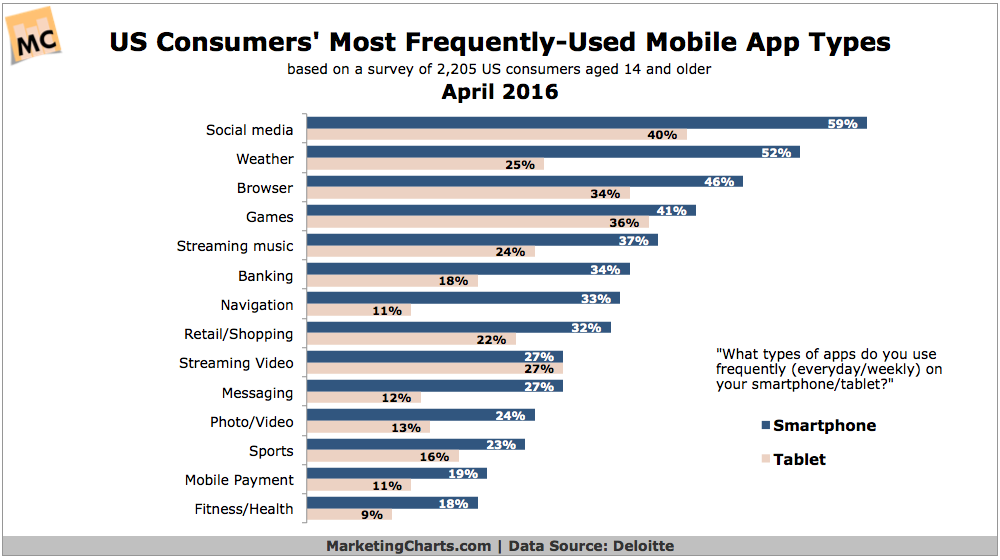
Consumers aged 14 and older access apps more frequently on smartphones than tablets, with social media the top app type on both devices.
Read MoreMost Effective Types Of Email Campaigns [CHART]
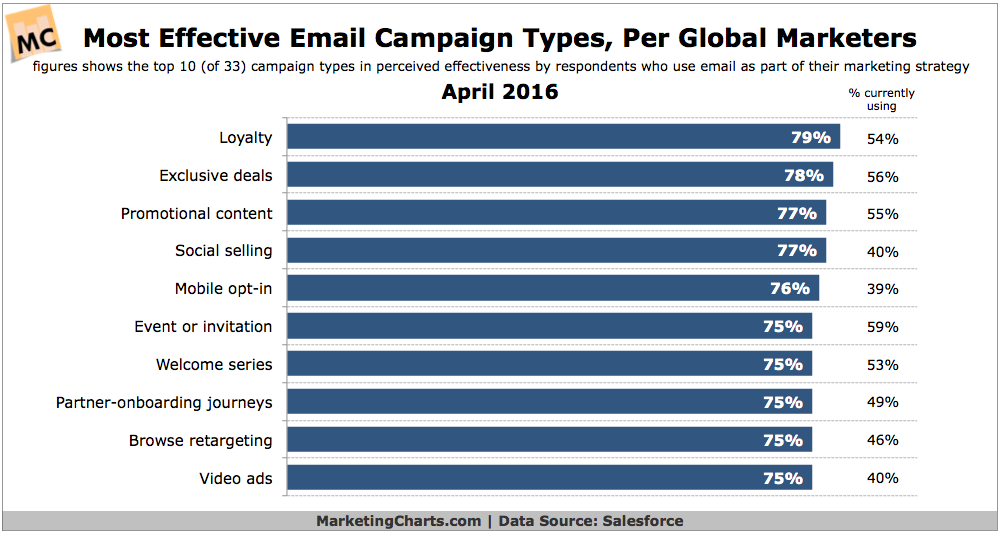
The most commonly used email campaign types aren’t always the most effective.
Read MoreUS Religious Affiliation By Age [CHART]
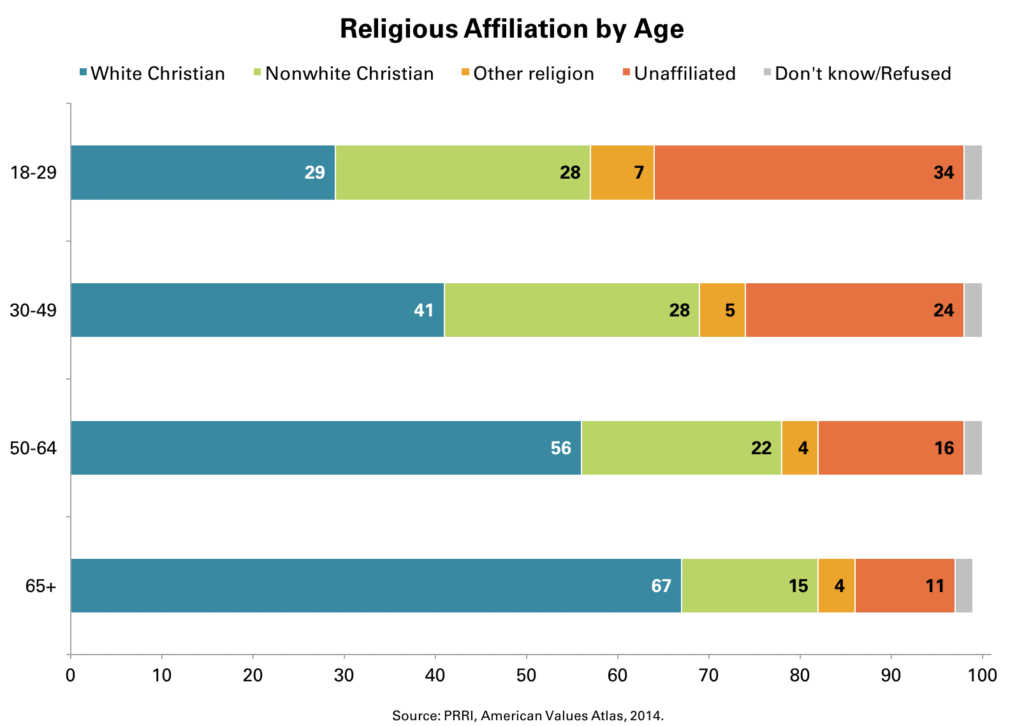
Today, young adults ages 18 to 29 are less than half as likely to be white Christians as seniors age 65 and older.
Read More