Video
Multitainment Behavior, 2015-2019 [CHART]
US consumers are spending more time with their digital devices than ever before, and that holds true while they’re already watching something else.
Read MoreSocial Media Channels As News Sources [TABLE]
A Pew Research Center survey of US social media users found that more are turning to Twitter, YouTube—and even Tumblr—to get news.
Read MoreDomain Name Facts [INFOGRAPHIC]

This infographic illustrates 101 fascinating facts about domain names you probably didn’t know and many you should know.
Read MoreData Generated Per Minute By Platform [INFOGRAPHIC]
This infographic illustrates just how much data media platforms ranging from Twitter and YouTube to Netflix and Spotify generate by the minute.
Read MoreWorld-Changing Technologies [CHART]
Marketers have their own ideas about the emerging technologies that will transform their customers’ experiences, but what about the broader public and how humans experience the world?
Read MoreTop Global Brands In 2017 [CHART]
Apple is once again the most valuable brand in the world, keeping its hold on the top spot for the fifth consecutive year, with Google following and slightly narrowing the gap.
Read MoreAmazon Echo Deal Queries [CHART]
Smart Speakers are already having an impact on commerce. Almost one-third of owners say they’re spending more on Amazon and Google since getting their Smart Speaker.
Read MoreTV Everywhere Adoption [CHART]
More than one-third (34.7%) of respondents with pay-TV service saying they access their providers’ TV Everywhere offering.
Read More4 Years Of Cryptocurrency Sales Visualized [VIDEO INFOGRAPHIC]
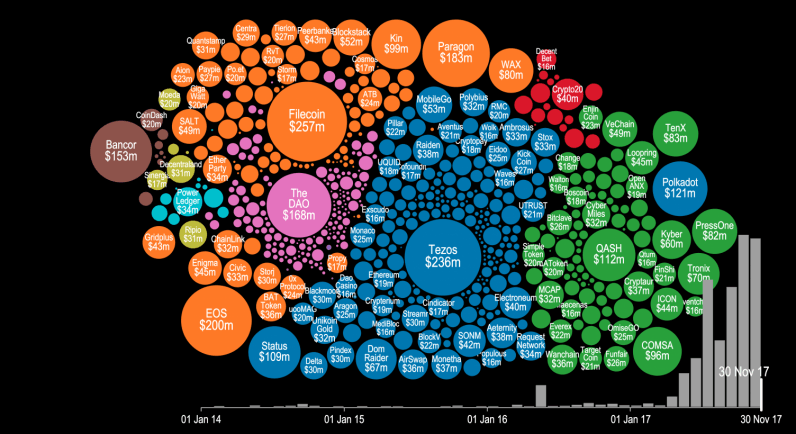
This video infographic shows the full history of token sales (aka initial coin offerings), from the early days of 2014 to their meteoric rise in 2017.
Read MoreCTR By Length Of Brand Content Headline [CHART]
Branded content headlines between 90 and 99 characters achieved a clickthrough rate (CTR) of 0.43%, higher than headlines with fewer characters.
Read More