Video
Global Average B2C eCommerce Sales Per Online Buyer by Region & Country, 2011-2016 [TABLE]
Average spending per user is lower in China but the sheer growth in China’s digital buyers is staggering.
Read MoreBeyond Social Media: Super Bowl XLVII Ads & Blackout Tweets [PODCAST]

This week’s highlights include the good and the bad of the Super Bowl ads, who took advantage of the blackout and how, a human conversation between two brands, and much more.
Read MoreGlobal Online Buyers By Country, 2011-2016 [CHART]
The US will remain the single country with the largest share of worldwide B2C ecommerce spending, at 29.6% in 2013—down from 31.5% in 2012 despite relatively strong growth.
Read MoreTop 5 Countries In B2C eCommerce Sales, 2011-2013 [CHART]
Sales in North America grew 13.9% to a world-leading $364.66 billion in 2012—a figure expected to increase 12.2% to $409.05 billion this year.
Read MoreGlobal B2C eCommerce Sales By Region, 2011-2016 [CHART]
In 2012, B2C ecommerce sales grew 21.1% to top $1 trillion for the first time.
Read MoreReddit Eyetracking Attention Order [HEATMAP]
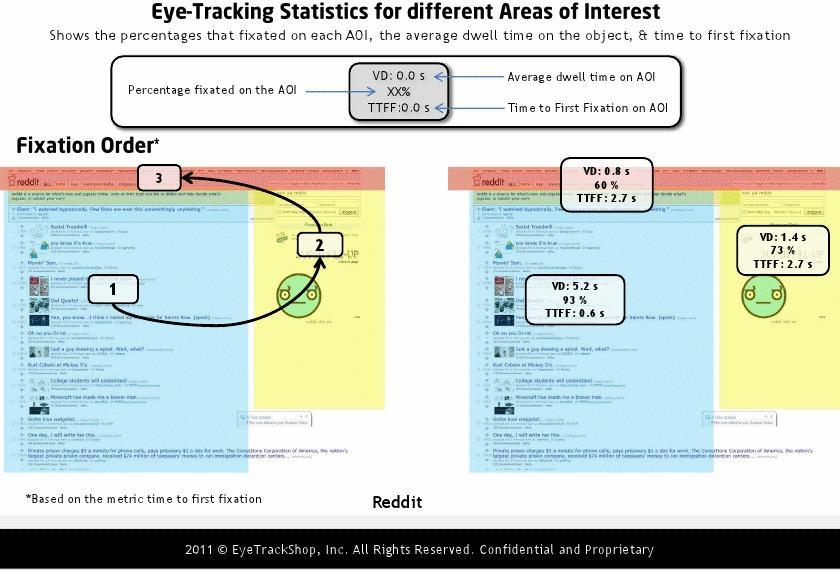
This heatmap illustrates the order in which people focus their attention on Reddit pages.
Read MoreReddit Eyetracking [HEATMAP]
This heatmap illustrates where people focus their attention when looking at Reddit pages.
Read More
Super Bowl XLVII-Related Searches During The Game [CHART]
This chart shows trending searches that were performed during the broadcast of Super Bowl XLVII.
Read MoreKlout Eyetracking Attention Order [HEATMAP]
This heatmap illustrates the order in which where people focus their attention on Klout profiles.
Read More