Video
Smart Phone Share Of US Mobile Market, October 2011 – December 2012 [CHART]
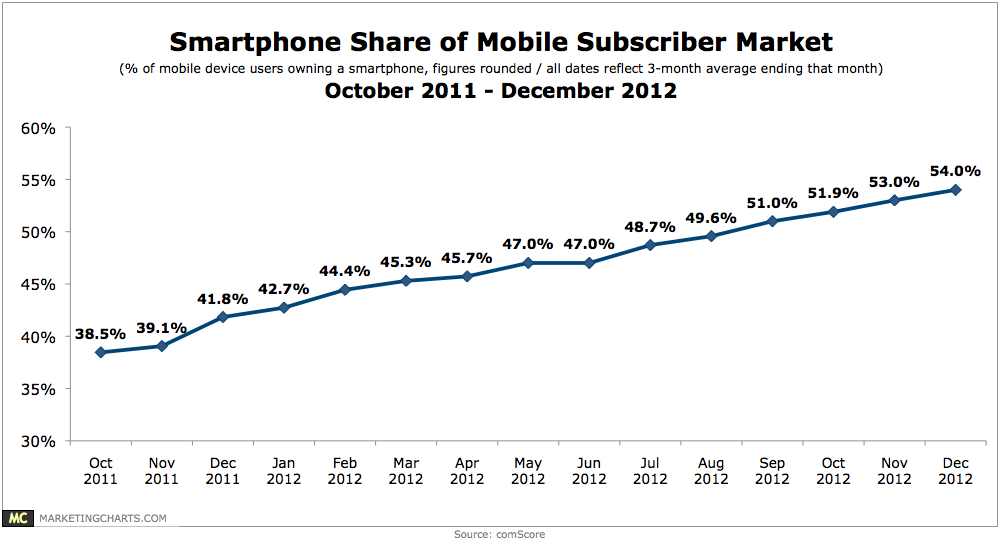
During the 3-month average ending in December 2012 (Q4), 54% of US mobile subscribers owned a smart phone, a 19.2% rise from the 3-month average ending March 2012 (Q1 – 45.3%).
Read MoreTop Mobile App Types For Data Consumption, September-December 2012 [CHART]
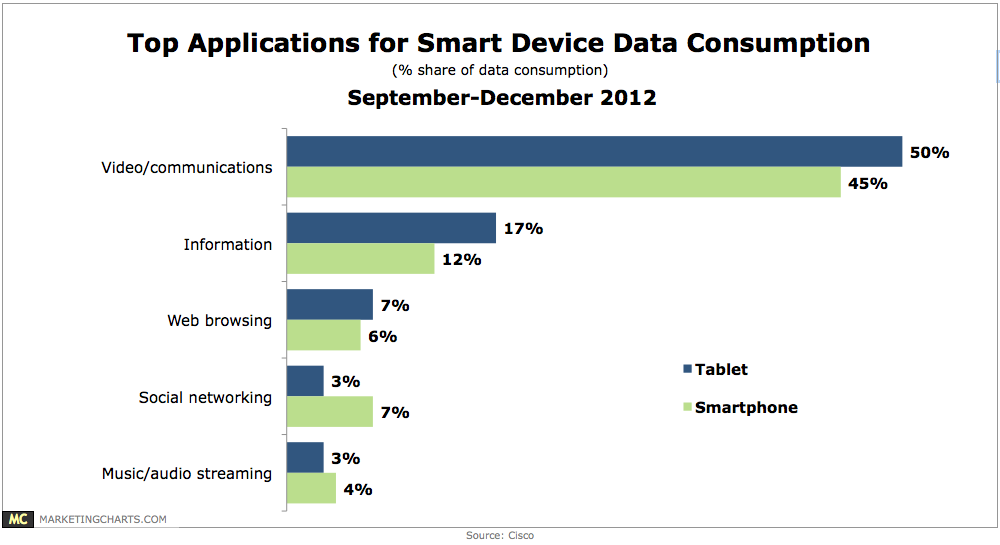
Video streaming and communications applications such as YouTube, Hulu, and Netflix accounted for exactly half of data consumption on tablets, and 45% on smartphones.
Read MoreExecutives' Views On Customer Experience & Loyalty, February 2013 [CHART]
74% of American senior executives surveyed by Oracle strongly agree that customers’ experiences impact their willingness to be loyal advocates.
Read MoreStumbleUpon Eyetracking Attention Order [HEATMAP]
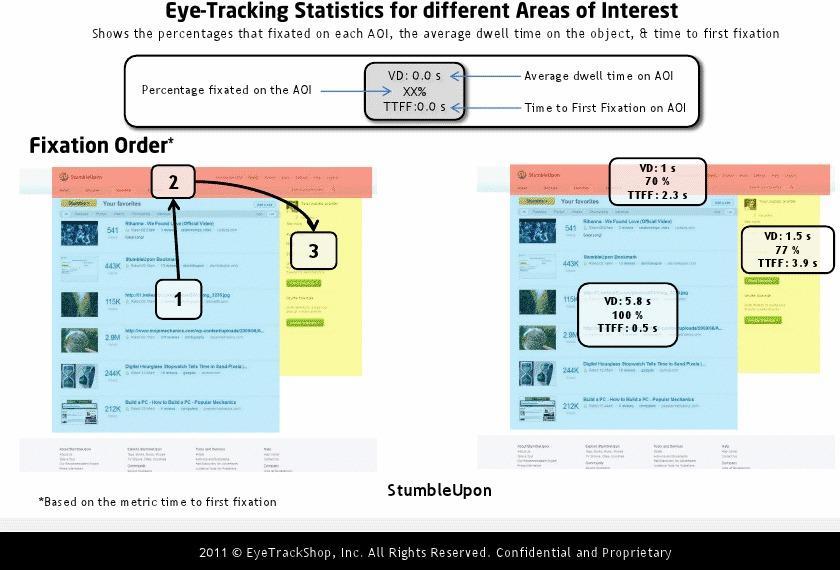
This heatmap illustrates the order in which people focus their attention at StumbleUpon.
Read MoreRise Of The Drones [VIDEO]

Meet a new breed of flying robots, from tiny swarming vehicles to giant unmanned planes. PBS’ NOVA looks at unmanned aerial vehicles and how the technology will shape the future.
Read MoreStumbleUpon Eyetracking [HEATMAP]
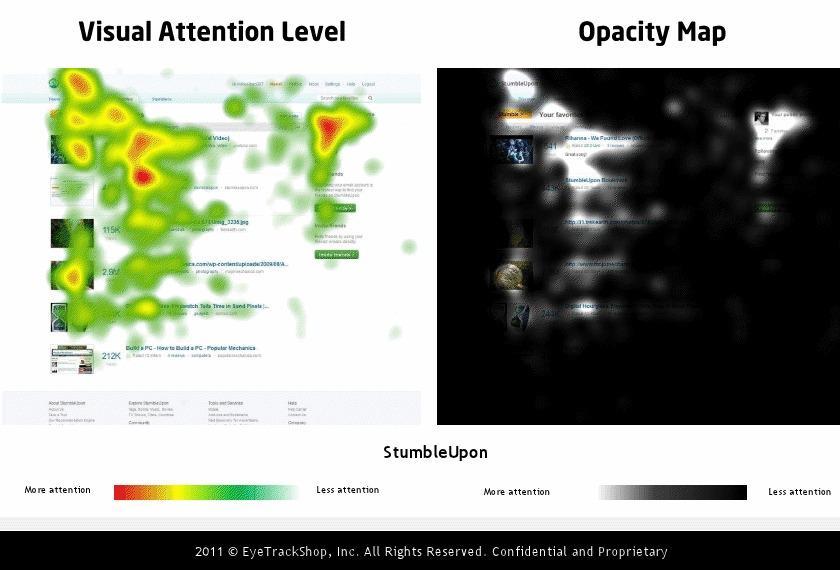
This heatmap illustrates where people focus their attention at StumbleUpon.
Read MoreUS Monthly Internet Radio Listeners, 2010-2016 [CHART]
Users are embracing internet radio on a growing range of devices, from PCs, smartphones and tablets to automobiles, connected-home appliances and other gadgets.
Read MoreObjectives For Video Marketing Efforts, December 2012 [CHART]

The consensus on objectives for online video campaigns of all kinds was that awareness is key—94.6% of respondents were looking to achieve that end.
Read MoreKey Performance Indicators For Native Video Ads, December 2012 [CHART]
The most common primary key performance indicators were brand lift, sharing and cost efficiency.
Read MoreTwitter Eyetracking Attention Order [HEATMAP]
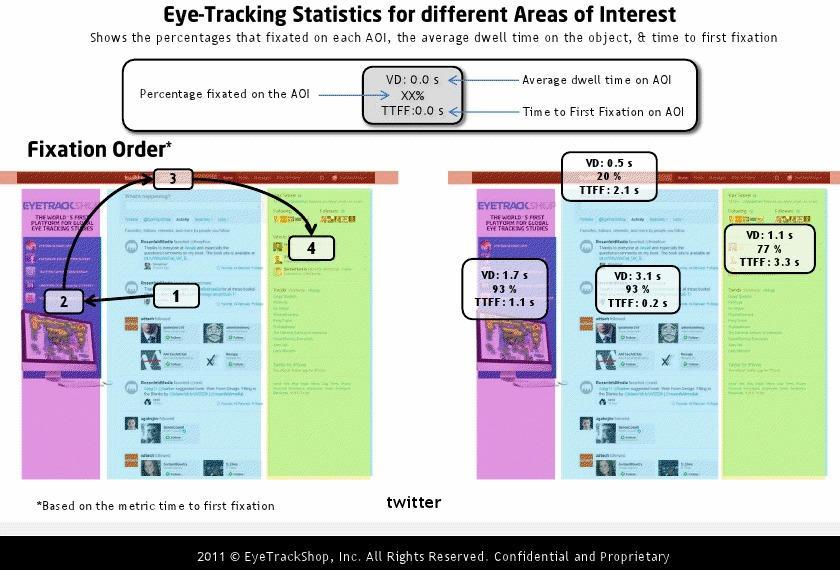
This heatmap illustrates the order in which people focus their attention on Twitter pages.
Read More