Video
US Core Gamers Who Buy Physical vs Digital Games, January 2013 [CHART]
Almost eight in 10 core gamers indicated that they were much more likely to purchase a physical media game over a digital game.
Read More
How Brands Foster Consumer Connectedness, April 2013 [CHART]
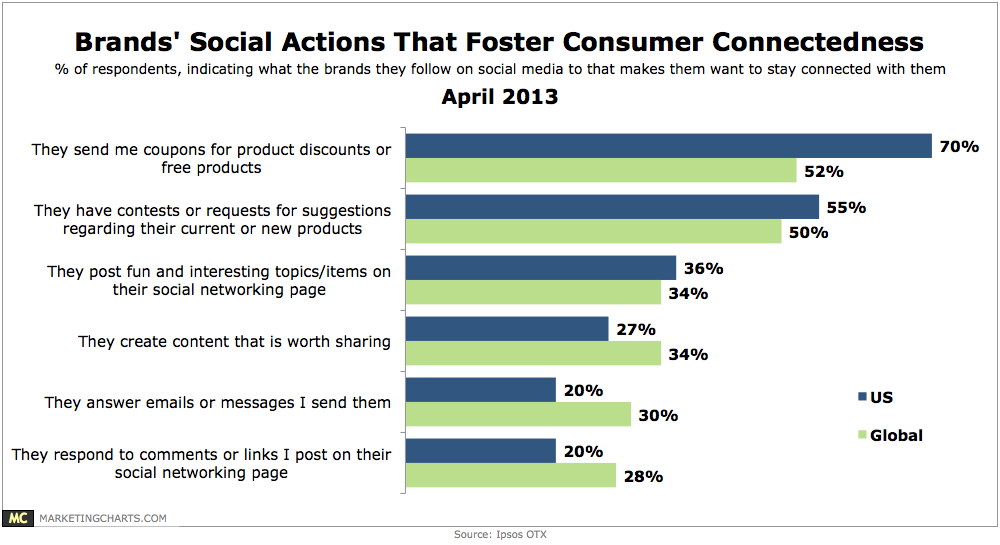
Asked what the brands they follow on social media do to make them want to stay connected to them, 70% said brands send them coupons for product discounts or free products.
Read MoreMobile Device Use By Activity & Device Size, February 2013 [CHART]
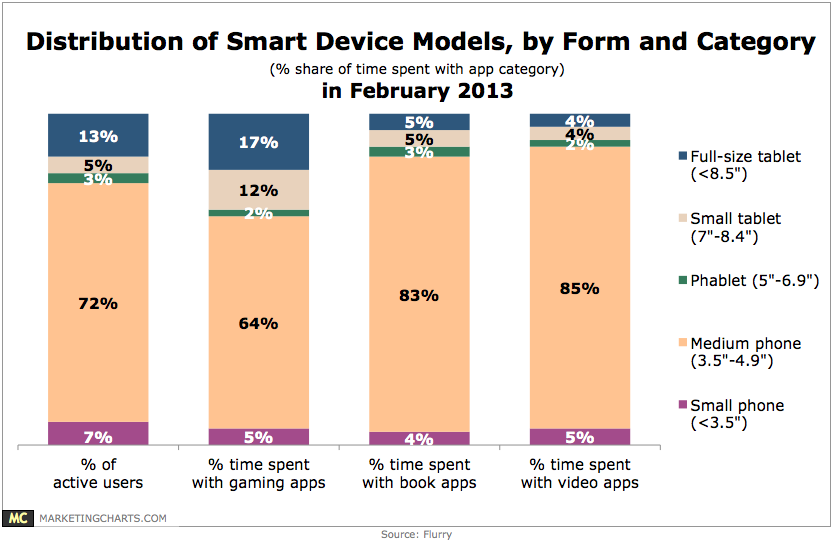
While small (5%) and full-size (13%) tablets accounted for less than 20% of active smart device users around the world, they represented 29% of time spent playing gaming applications on such devices in February 2013.
Read MoreBeyond Social Media: Macy's $1,453 Typo; Yelp Reviews; Prankvertising; Kevin Ware & Social Empathy [PODCAST]

This week: Macy’s $1,453 Typo; Yelp’s Filtered Reviews; Nike’s Winning Ad Lampooned; Prankvertising; Kevin Ware & Social Empathy; Silent Instagram Film Trailers; Punch Pizza Goes To Naples; HP’s Bouncing Cam; Blogging Rules; Shiny New Stuff & Daily Numbers.
Read MoreGlobal Netflix Revenues By Region, Q4 2011-Q4 2012 [TABLE]
Netflix reported US streaming revenues of $2.19 billion for 2012, with moderate growth from quarter to quarter.
Read MoreLikely Cable To Streaming Video Subscription Switchers [TABLE]
12% strongly agreed with the statement: I would consider replacing my cable subscription with a streaming media subscription (e.g., Netflix, Hulu Plus) in 2013.
Read MoreDigital TV & Movie Viewers, 2012-2017 [CHART]

The number of US digital TV viewers will reach 145.3 million in 2017, up from 106.2 million in 2012.
Read MoreContent Sharing Trends, April 2013 [TABLE]
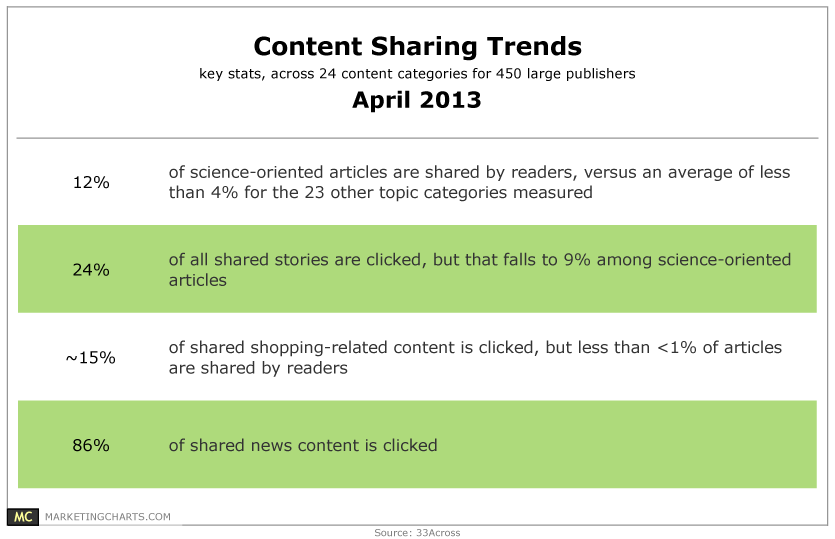
The types of content that people share may be driven more by ego than anything else.
Read MoreClick-Through Rates For Emails That Include Social Sharing, April 2013 [CHART]
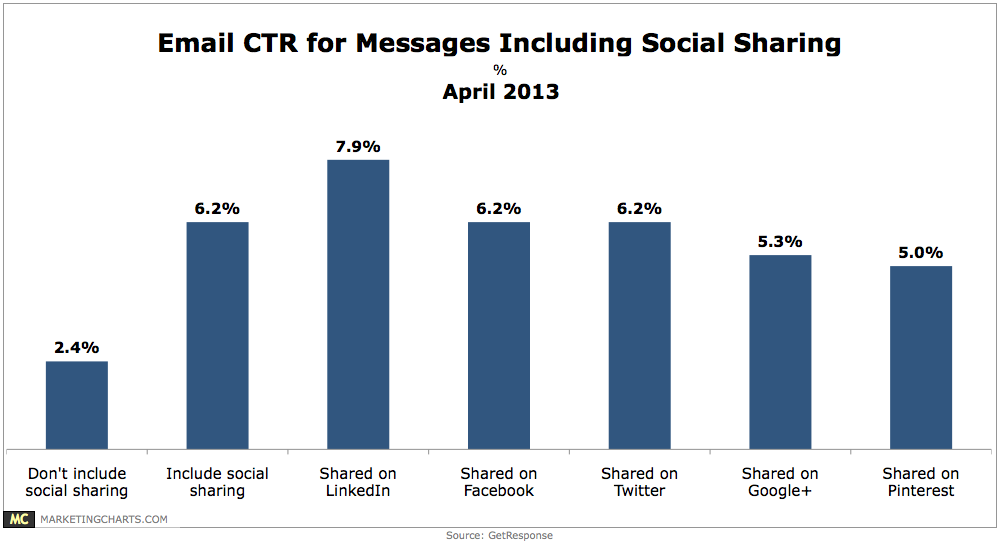
Emails that include social sharing buttons have a click-through rate 158% higher than those do not (6.2% vs. 2.4%).
Read More