Video
Devices Used By Stage Of Local Business Searches, December 2012 [CHART]
Where mobile phones and tablets really showed their specific utility was in the share of local searches that ended on the devices—18% for each, compared with 4% of PC searches.
Read MoreMobile Americans Who Use Search/Navigation Sites or Apps, April-December 2012 [CHART]
In only eight months, the number of overall US searches on mobile phones and tablets rose 21%.
Read MoreTeens' Favorite Social Networks, April 2013 [TABLE]
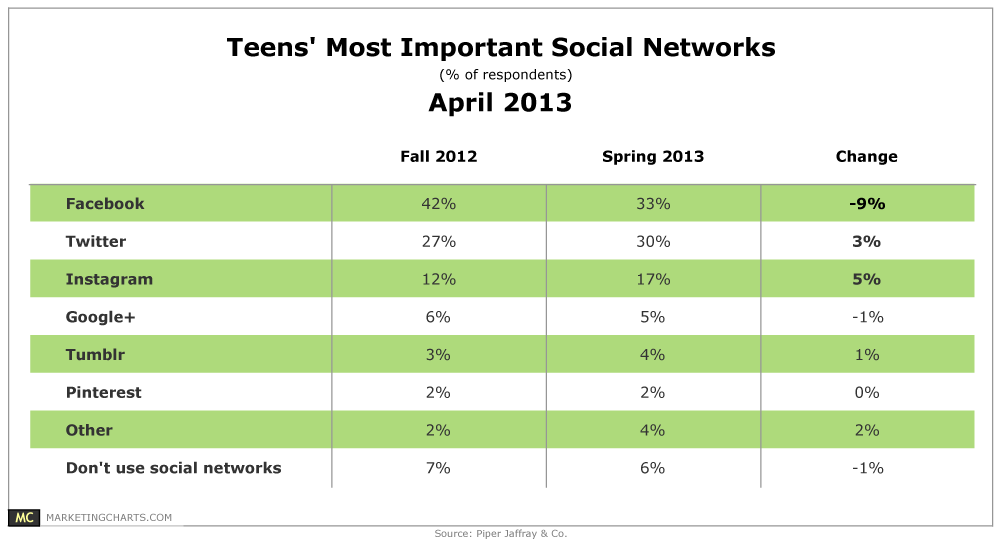
30% of teens name Twitter as their most important social network, close behind the 33% who tab Facebook.
Read MoreTop Local Markets For Digital Media Use, 2012 [TABLE]
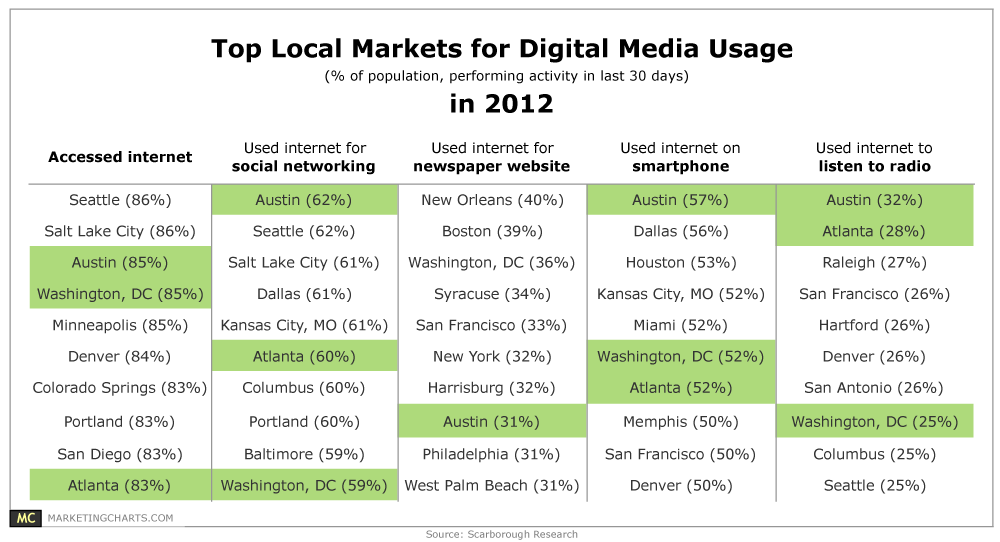
Use of the internet for social networking was highest in Austin and Seattle (62% of each market’s population in the 30 days prior to the survey), while New Orleans topped the charts for newspaper website access (40%).
Read MorePricing Movitivation & Showrooming, April 2013 [CHART]
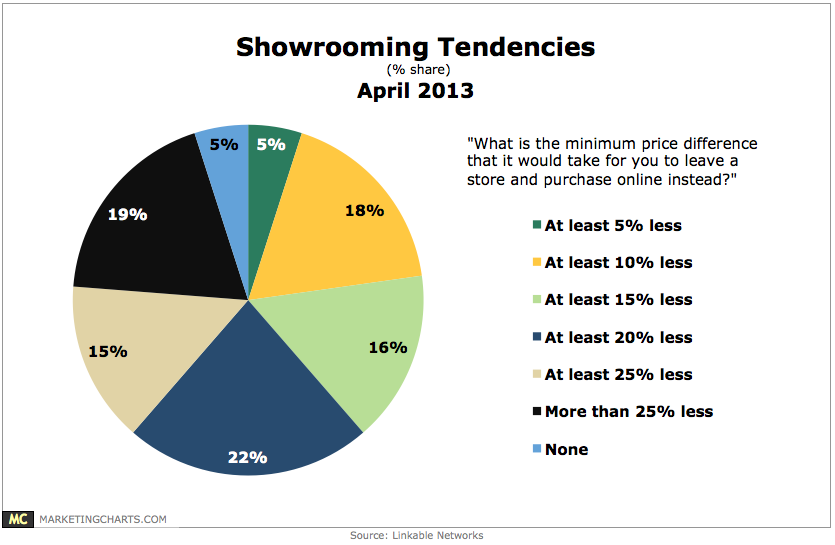
Two-thirds of mobile device owners say they check their device while shopping in a store to see if there is a cheaper price elsewhere.
Read MoreMarketing Input Consumers Would Give For $25, April 2013 [CHART]
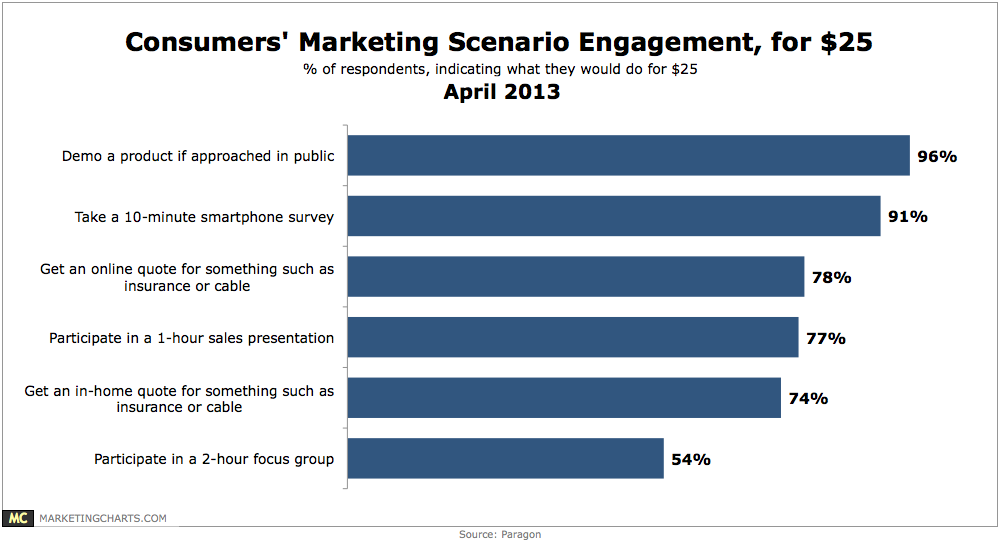
For $25, 96% of consumers would demo a product or service if approached in a public setting.
Read MoreDevices Use For Multitainment, 2012 vs 2013 [CHART]
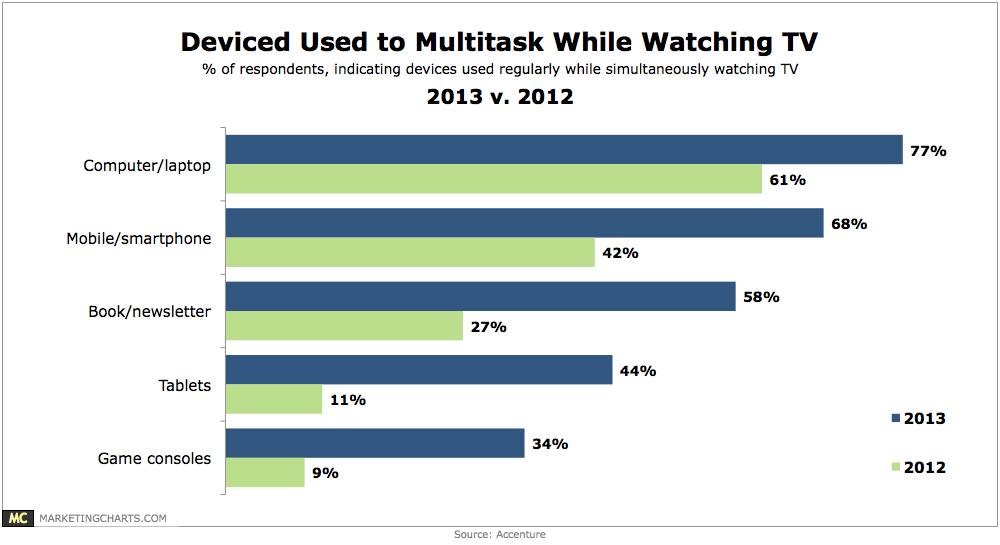
Regular use of tablets while watching TV (on a TV set) has soared from 11% in 2012 to 44% this year.
Read MoreTop Places New Vehicle Buyers Look For Product Information, August 2012 [CHART]
74% of US new-vehicle buyers surveyed used dealership websites, via desktop, mobile phone or tablet, during the buying process.
Read MoreMobile Search Behavior, April 2013 [TABLE]
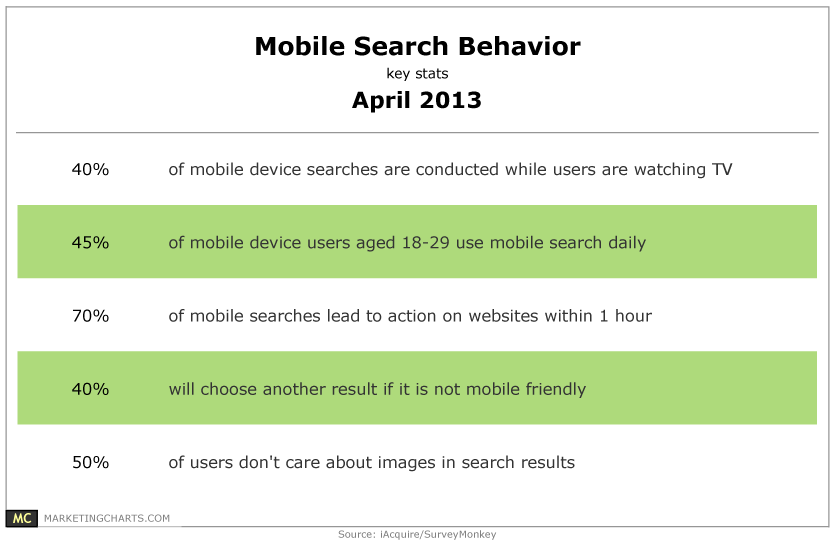
40% of mobile searches are conducted while users are watching TV.
Read MoreTop Sources For Coupons, April 2013 [CHART]
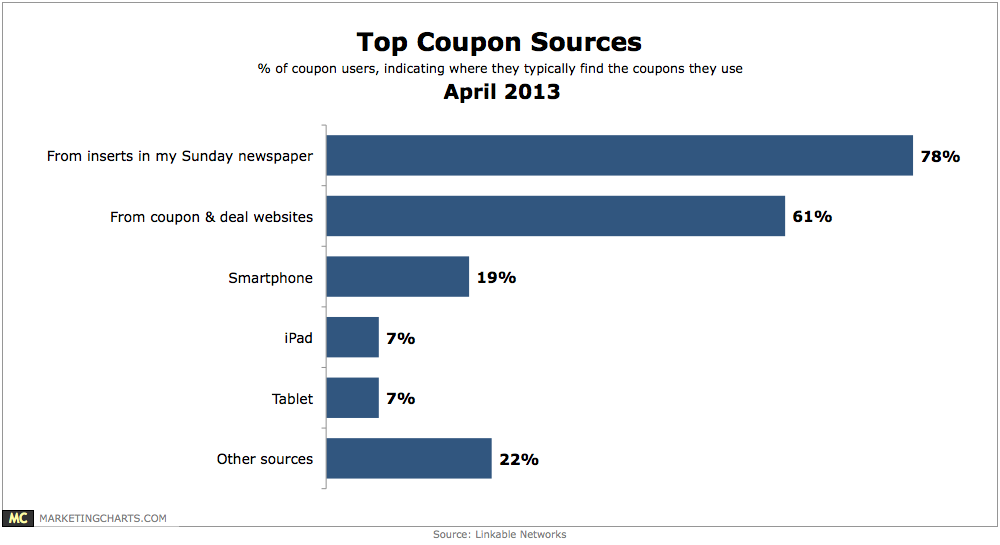
95% of consumers use coupons when they shop, including 30% who claim to do so every time they shop.
Read More