Video
Satisfaction With Social Media Sites [CHART]
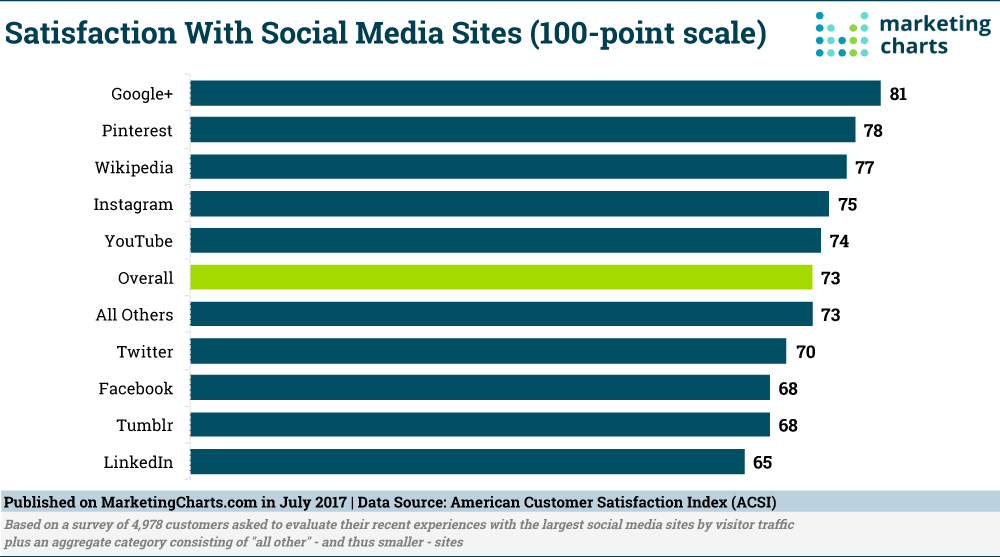
Social media user satisfaction remains steady this year though it is still in the lower tier of industries on this measure. The overall index for social media is unchanged at 73 on a 100-point scale, though some platforms are better rated than others.
Read MoreUsing Social Media For Customer Retention [INFOGRAPHIC]
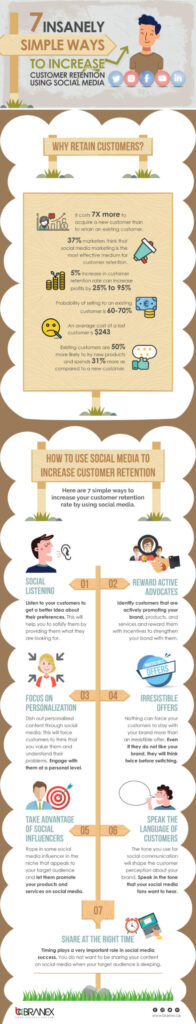
It costs seven times more to acquire a new customer than it does to retain an existing one. This infographic from Branex illustrates seven ways you can use social media for customer retention.
Read MoreDesktop Web Ads Ranked From Not-So-Horrible To Worst [CHART]
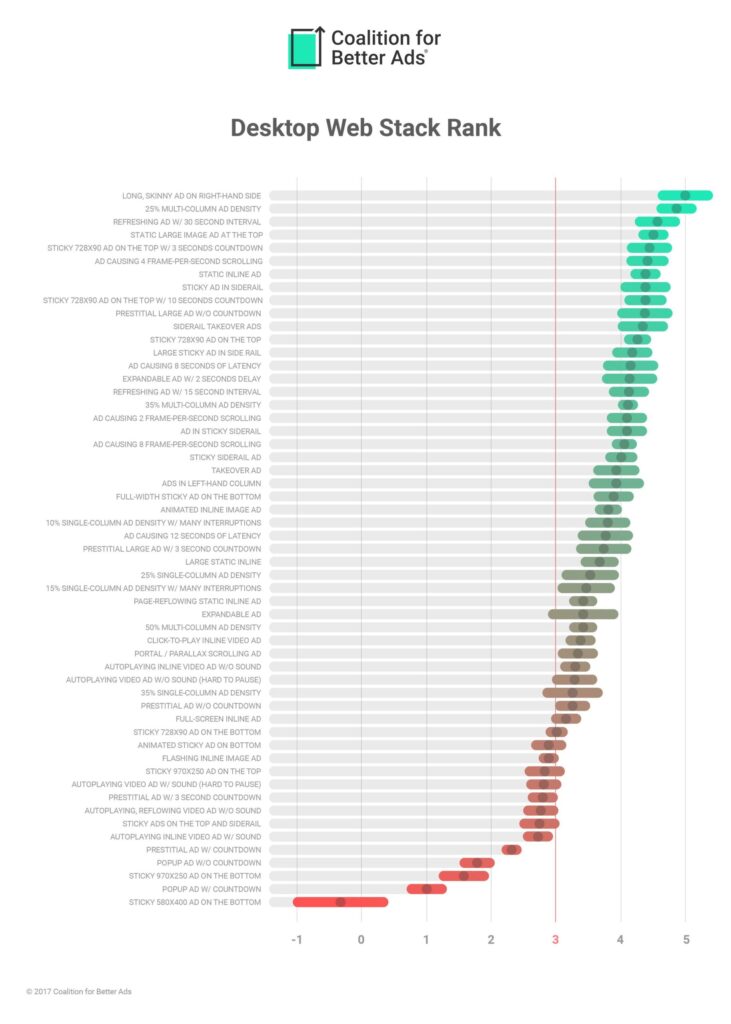
Examples include video ads that play at full volume, flashing display ads, popups with hard-to-find exit buttons and prestitial ads that block users from seeing content on the page.
Read MoreMobile Web Ads Ranked From Not-So-Horrible To Worst [CHART]
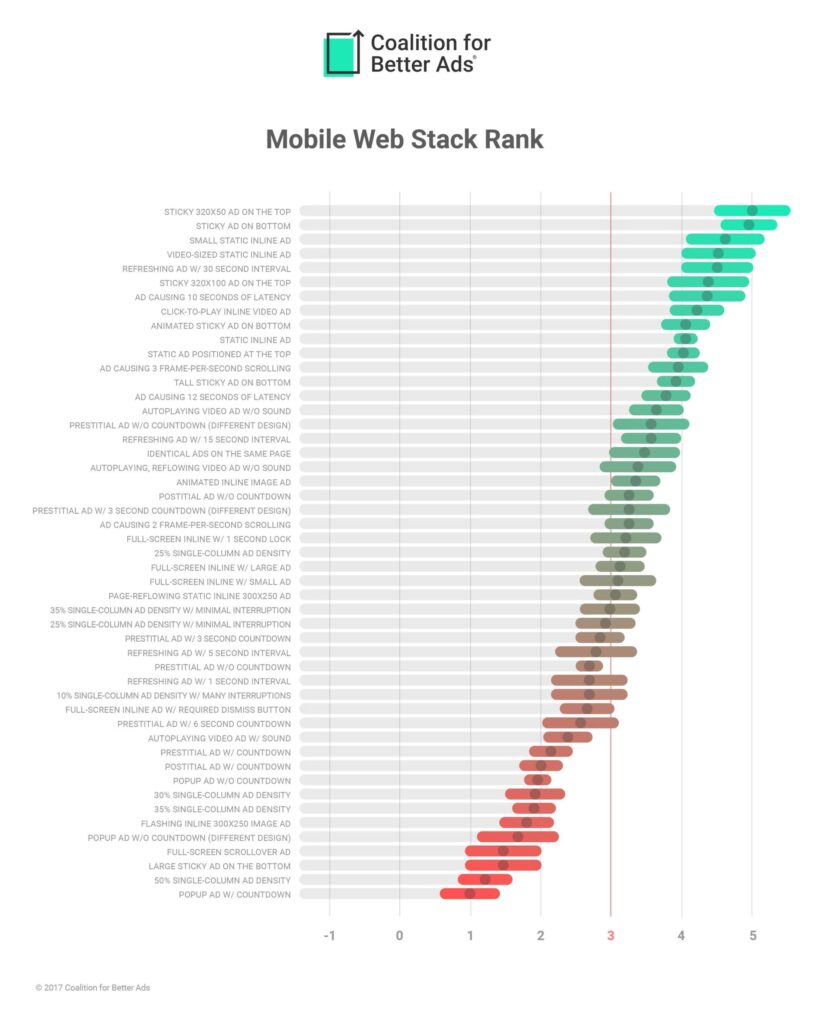
Based on surveys of 25,000 internet users in North America and Europe conducted by the Coalition (though namely by Google), roughly 85 percent of mobile users surveyed said they found anchor ads only a little annoying or not annoying at all.
Read MoreGoogle vs Facebook Referral Traffic, 2017 [CHART]
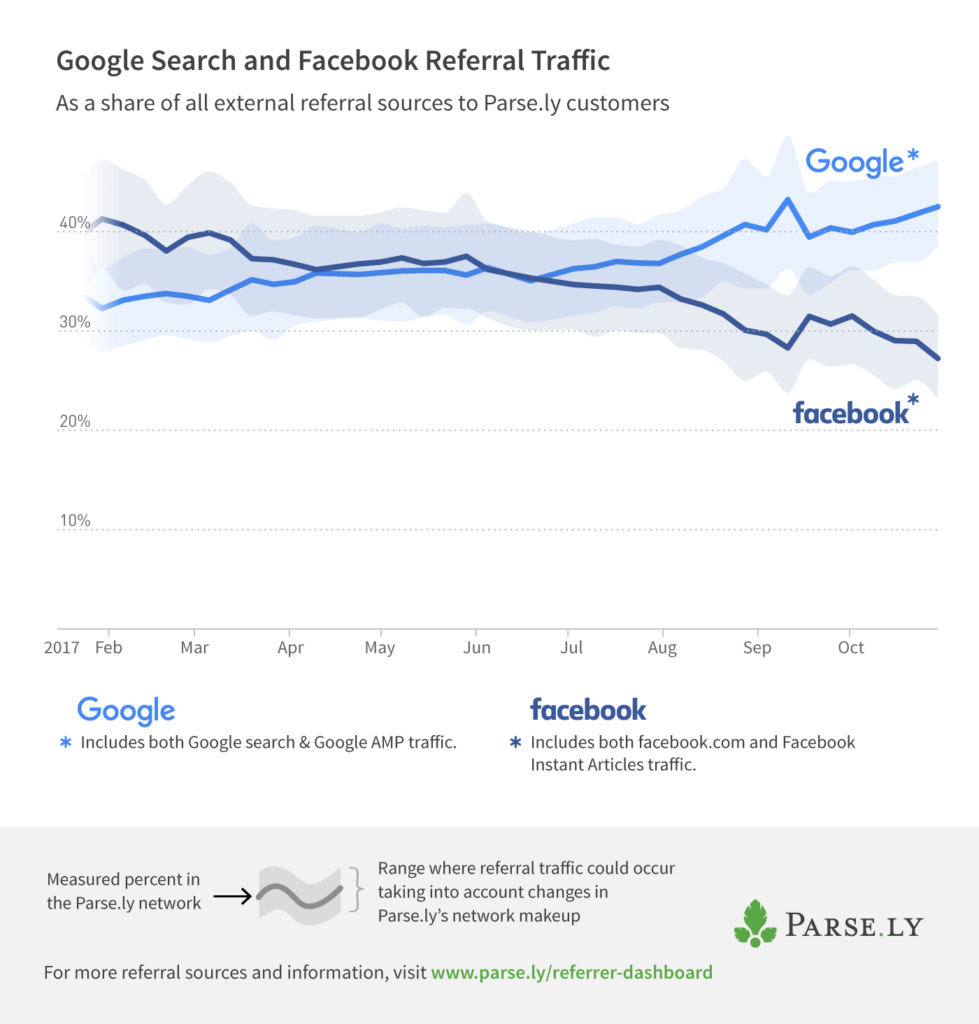
This Parse.ly data reflects the upward trend in referral traffic from Google (all – including AMP – Google’s Accelerated Mobile Pages format) and declining trend in referral traffic from Facebook specifically (all Facebook – including Instant Articles).
Read MoreSearch Engine vs Social Traffic, 2011-2017 [CHART]
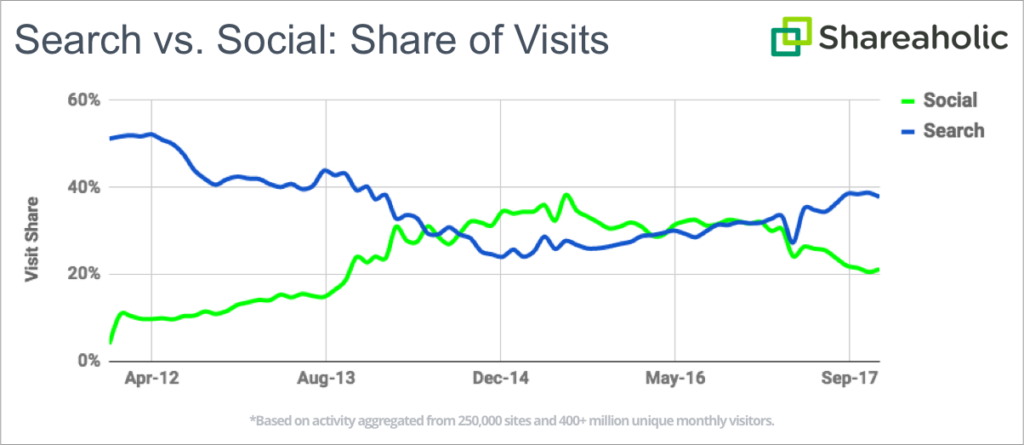
Google was the top overall traffic referrer for the year, and owned a 36.82 percent share of visits during the second half of 2017.
Read MoreWebsite Referrals By Social Channel, 2016-2017 [CHART]
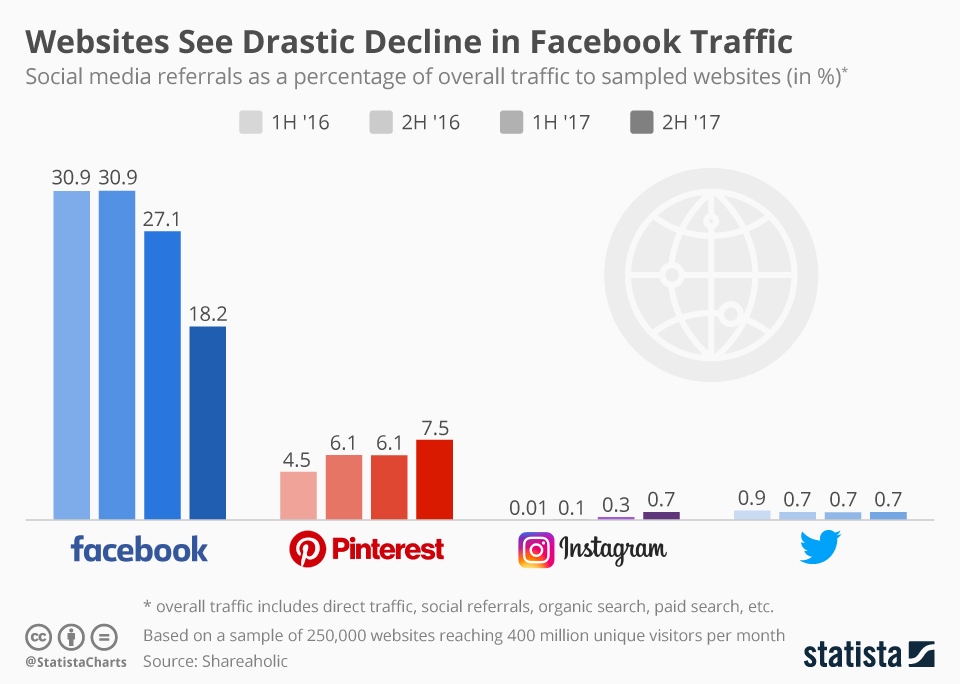
According to a report by Shareaholic, the percentage of website traffic coming from Facebook has already declined drastically in the second half of 2017.
Read More360 Videos [INFOGRAPHIC]
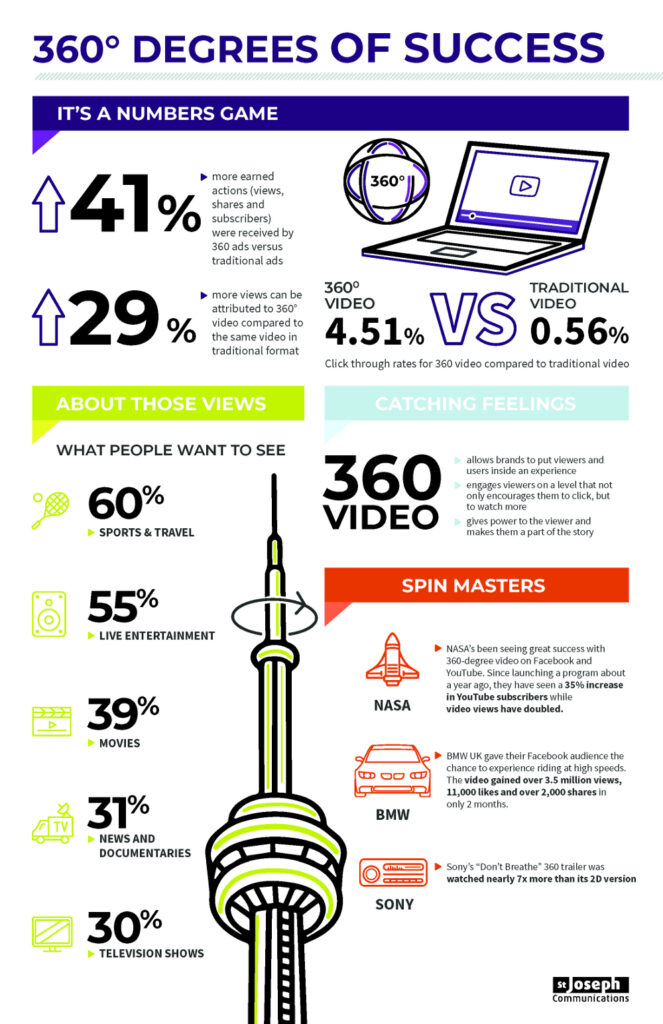
This infographic examines engagement with 360 videos, claiming that they enjoy clickthrough rates averaging 4.51%, compared to 0.56% for traditional videos.
Read MoreSmart Speaker Ownership [INFOGRAPHIC]
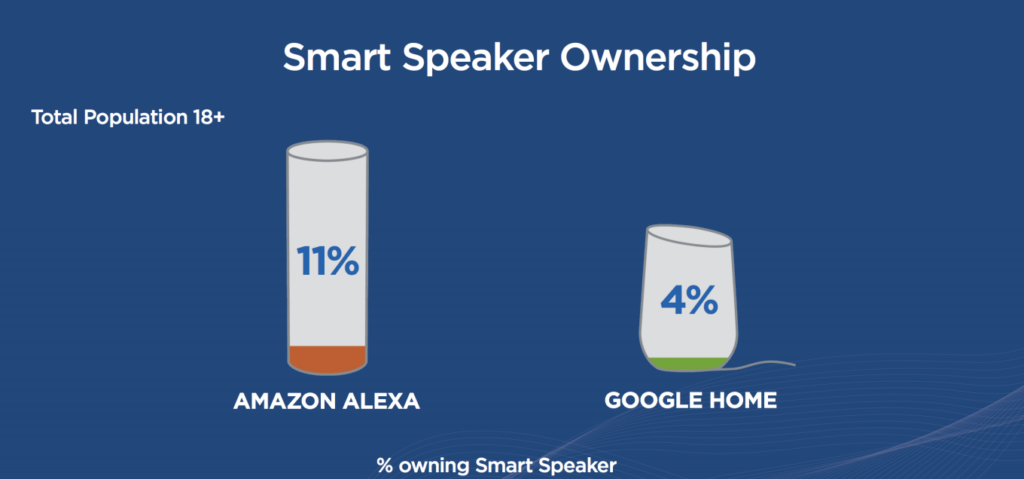
One in six Americans now own a smart speaker, according to new research out this week from NPR and Edison Research – a figure that’s up 128 percent from January, 2017. Amazon’s Echo speakers are still in the lead, the report says, as 11 percent now own an Amazon Alexa device compared with 4 percent who own a Google Home product.
Read MoreSmart Speaker Answer Accuracy By Category [CHART]
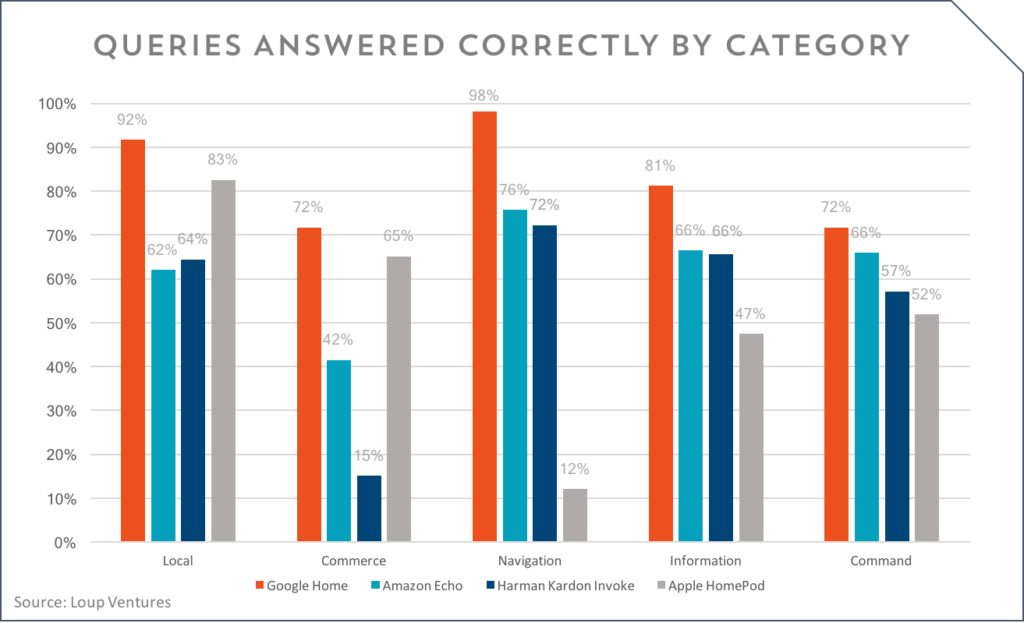
Loup Ventures put Apple’s HomePod through the smart speaker gauntlet which included 782 queries and compared the HomePod’s accuracy to Amazon Alexa, Google Home, and Microsoft’s Cortana.
Read More