Video
Promotional Plans Of American Pharmaceutical & Biotech Companies, June 2012 [TABLE]
33% of pharmaceutical companies are digital beginners.
Read MoreAmericans Who Use Social Media For Health Needs, 2011 & 2012 [TABLE]
Roughly 45% of US adult consumers used social media for health-related purposes in 2012.
Read MoreWho People Share Customer Service Stories With, April 2013 [CHART]
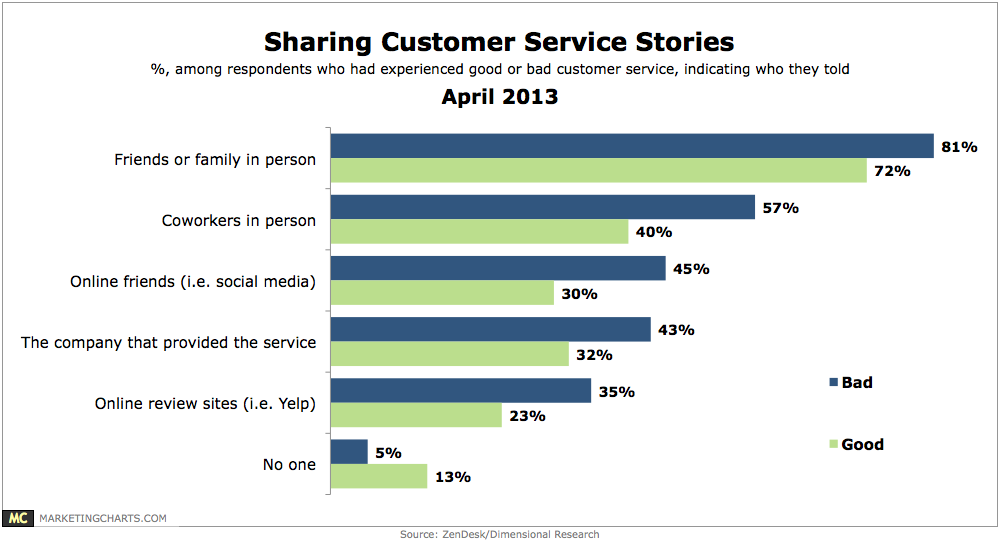
62% of B2B and 42% of B2C customers purchased more after a good experience, while 66% and 52% respectively stopped making purchases after a bad experience.
Read MoreBinge TV Viewing By Generation & Gender, April 2013 [CHART]
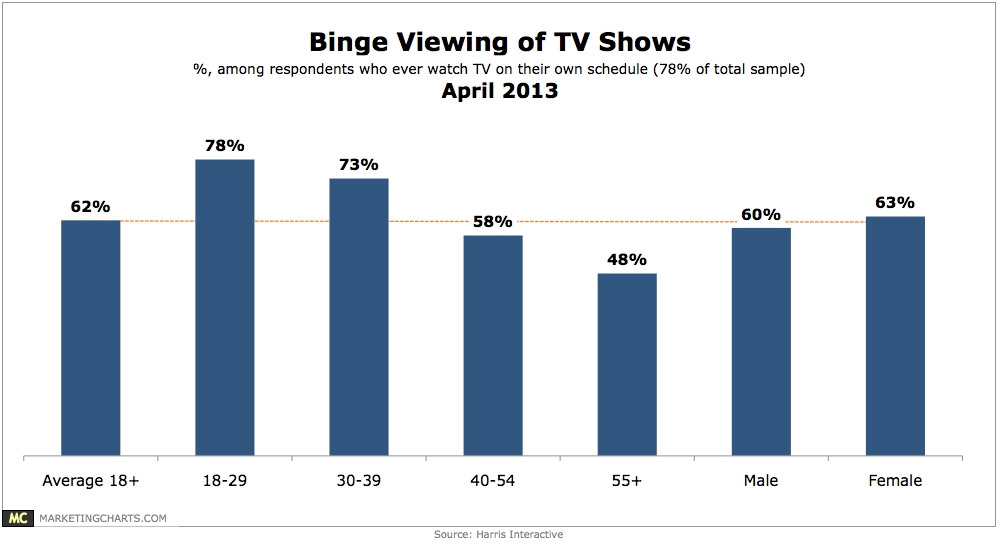
78% of Americans have watched TV on [their] own schedule and 62% of those have watched multiple episodes of a TV show at a time.
Read MoreWeekly Time Spent Using IM/Chat Apps By Mobile OS, April 2013 [CHART]
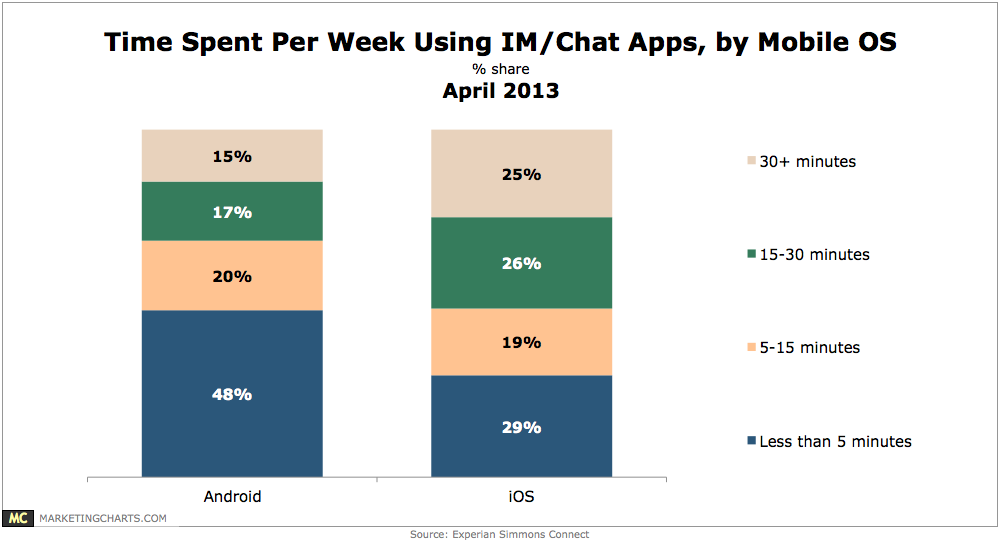
Android mobile owners are 2.4 times more likely than iPhone owners to use mobile IM/chat applications such as Whatsapp and Kik Messenger, but iPhone owners are heavier users of the apps.
Read MoreRetailers’ Mobile Price Comparison Policies, April 2013 [CHART]
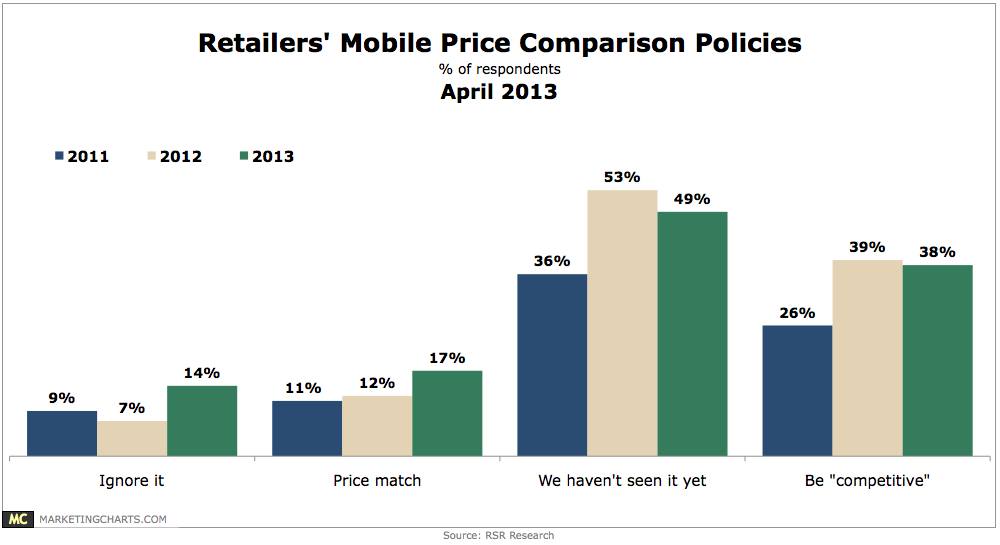
A greater proportion of retailers are choosing to either ignore showrooming practices or price match, although the predominant way of dealing with showrooming remains simply aiming to stay competitive.
Read MoreMobile Acts Prompted By Top Magazines By Month, 2011-2012 [CHART]
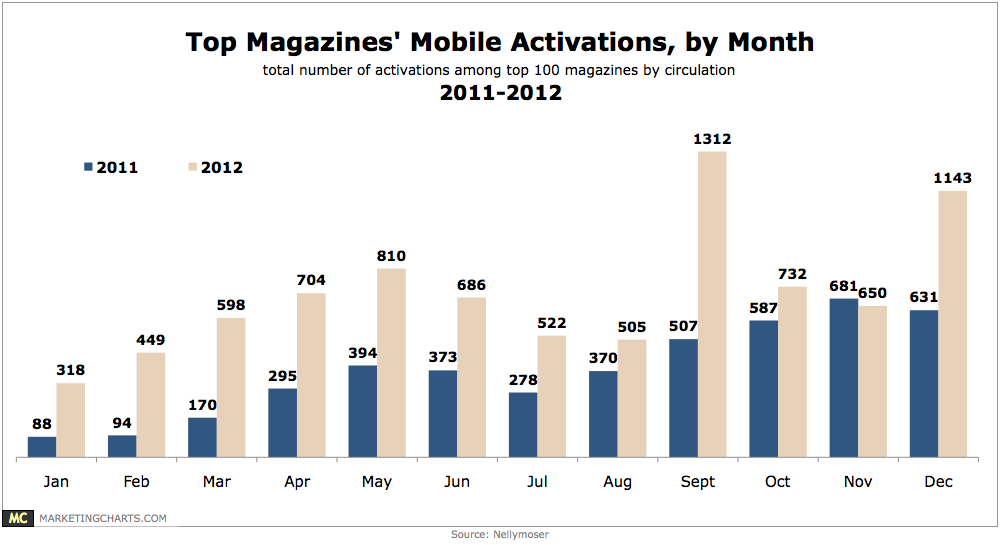
The number of mobile activations in the US’ top 100 magazines by circulation has grown from just 352 in Q1 2011 to 2,252 in Q4 2012.
Read MoreAd Awareness By Generation & Context, April 2013 [CHART]
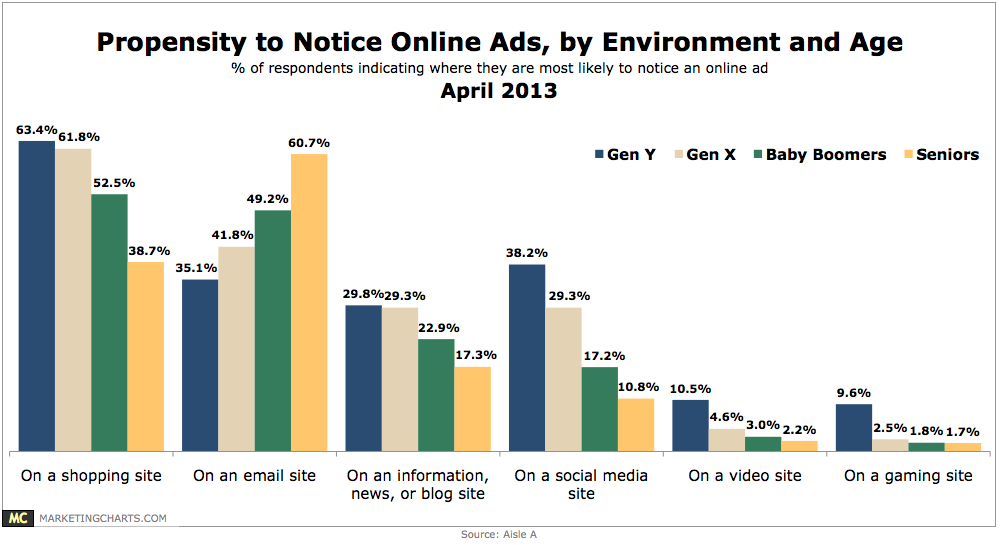
About half of consumers often (18.2%) or sometimes (33%) pay attention to online ads.
Read MoreOnline Media Consumption Of CEOs, April 2013 [CHART]
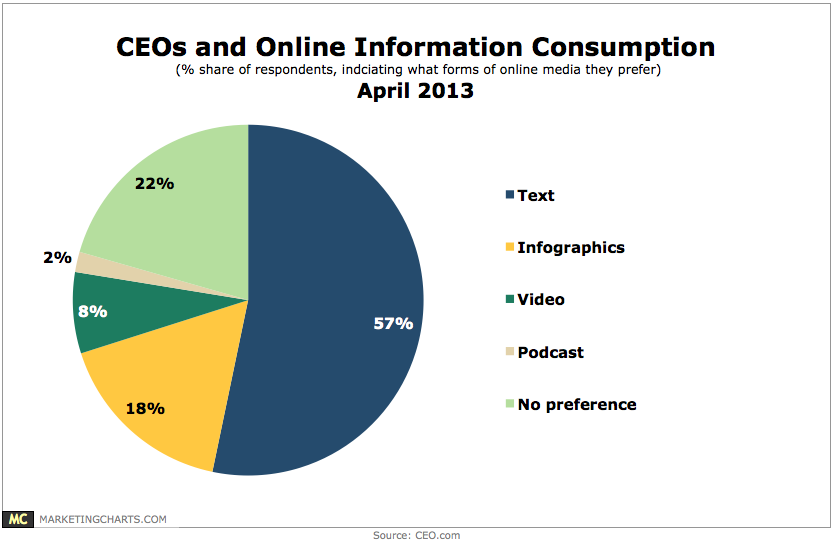
3 in 4 CEOs aged under 50 say they “mostly consume information online,” and close to 2 in 3 aged over 50 agree.
Read MoreHappiness By Generation, April 2013 [CHART]
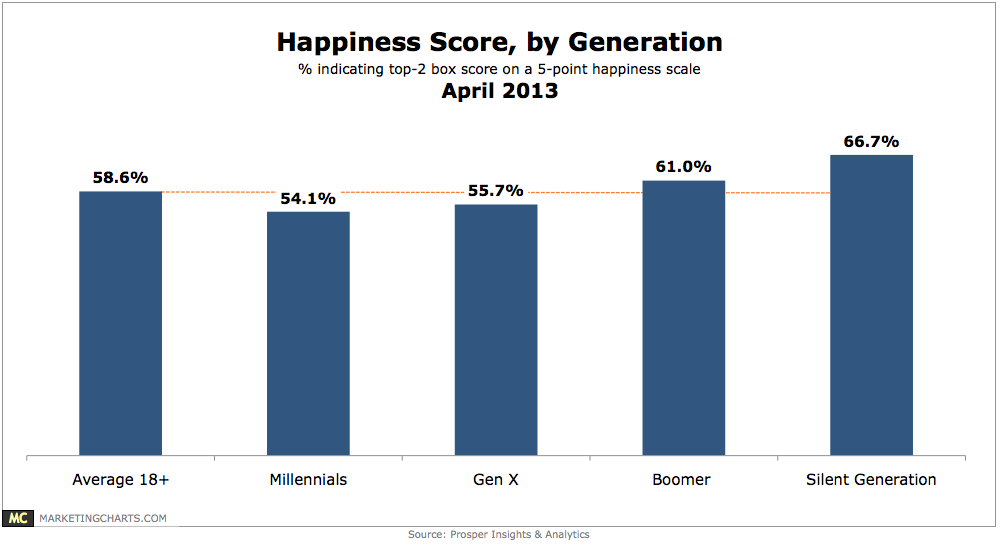
Millennials are 7.7% less likely than the average American to say they are happy.
Read More