Video
Small Biz Owners' Social Media Activity, April 2013 [CHART]

81% of small business owners say they’re spending more (49%) or the same amount (32%) of time on social media compared to a year ago.
Read MoreConsumers & Cross-Channel Retail, April 2013 [TABLE]
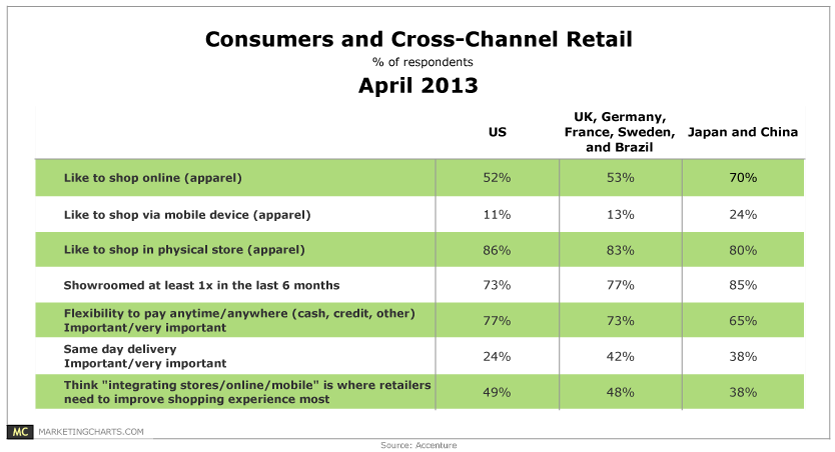
49% of US consumers believe the best thing that retailers can do to improve the shopping experience is to better integrate in-store, online and mobile shopping channels.
Read MoreUS Local Mobile vs Desktop Search Volume, 2011-2016 [CHART]
Google estimated that 20% of searches across all platforms worldwide have local intent.
Read More
How People Binge On TV, February 2013 [CHART]

Most US TV viewers (63%) had used an online subscription service (like Netflix) to binge-view TV.
Read MoreBinge TV Viewing Behavior By Demographic, February 2013 [TABLE]
62% of people watched multiple episodes of a TV show in succession, also known as “binge-viewing.”
Read MoreHow People Watch Time-Shifted TV By Demographic, February 2013 [TABLE]
Nearly eight out of 10 US adult internet users watched TV on their own schedule.
Read MoreEffect Of Streaming Video On Traditional TV Consumption, 2006-2012 [CHART]
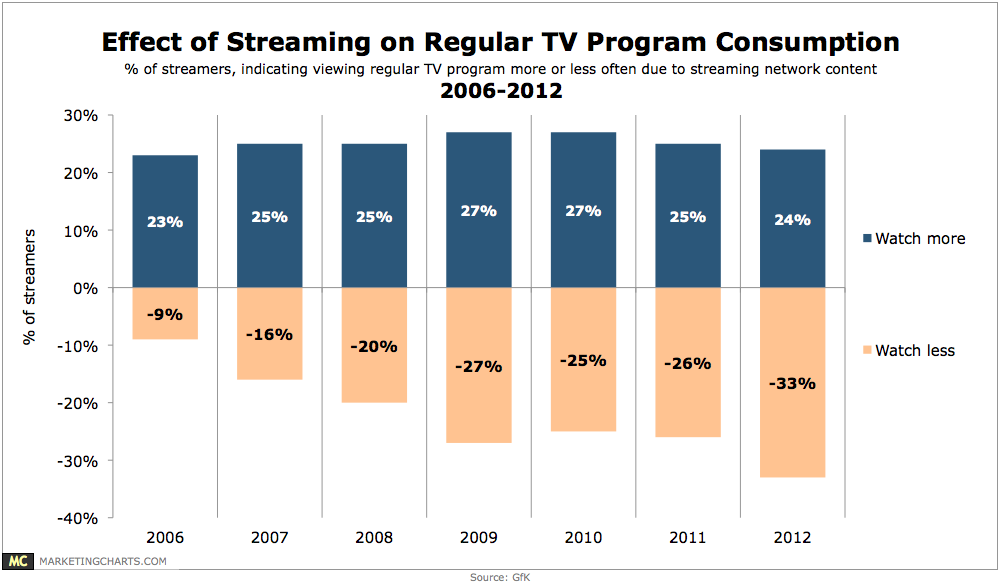
34% of US internet users (and 30% of all consumers aged 13-54) surveyed in December 2012 reported having watched streaming video content that originated from a network since the beginning of September.
Read MoreShare Of Americans' Time Online By Category, 2011 vs 2012 [CHART]
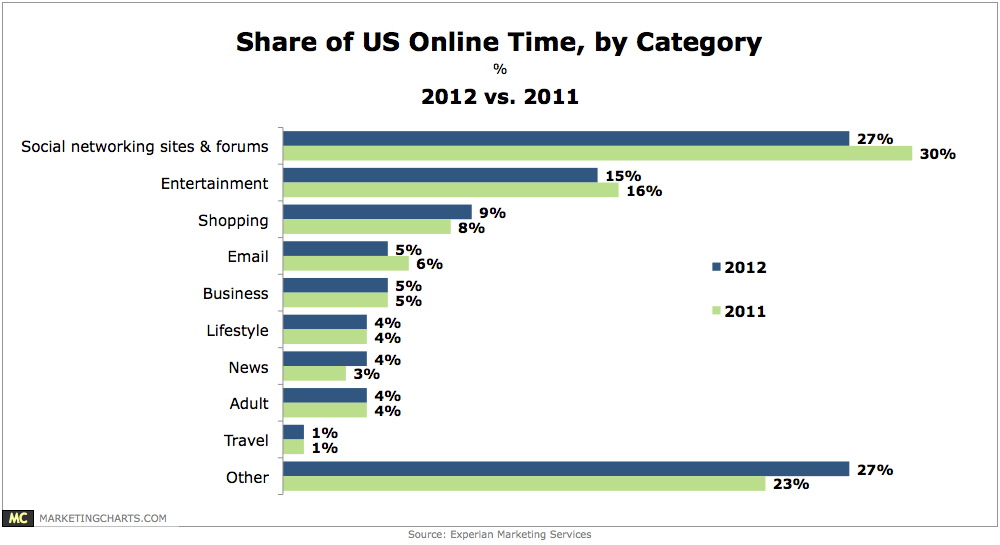
27% of Americans’ time spent online last year was spent accessing social networking sites and forums.
Read MoreCPG Mobile Advertising Post-Click Actions, 2012 [CHART]
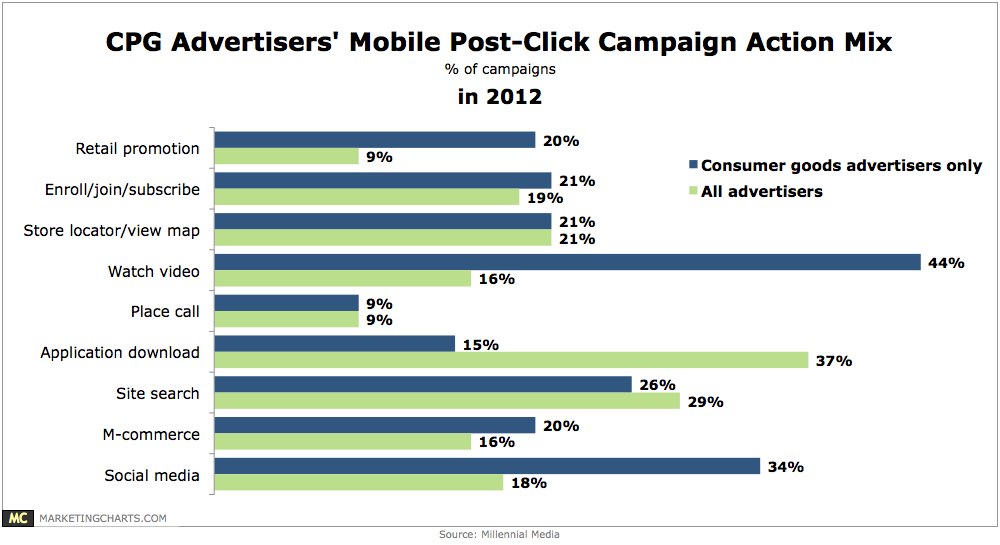
CPG brands were more focused on encouraging consumers to watch video, with 44% of the campaigns incorporating a video aspect (compared to 16% on average).
Read More