Video
Viral Wannabes By Age [CHART]
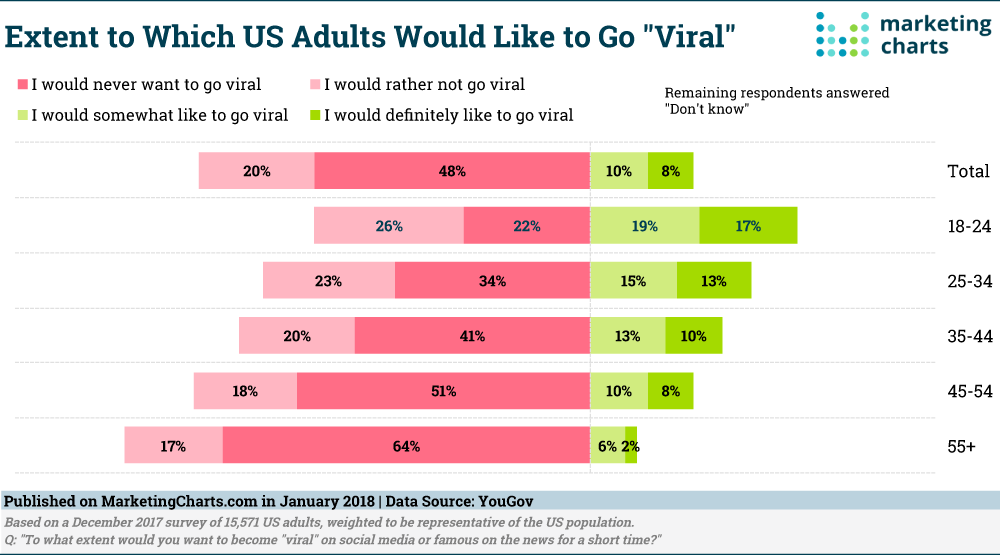
Does the thought of going viral sound exciting – or does it make you recoil? It turns out that fewer than 1 in 5 American adults would like to become viral on social media or famous on the news for a short time, according to a recent YouGov survey. The results indicate that men (22%) would be significantly more apt than women (15%) to welcome the attention.
Read MoreTelephone Survey Response Rates, 1997-2017 [CHART]
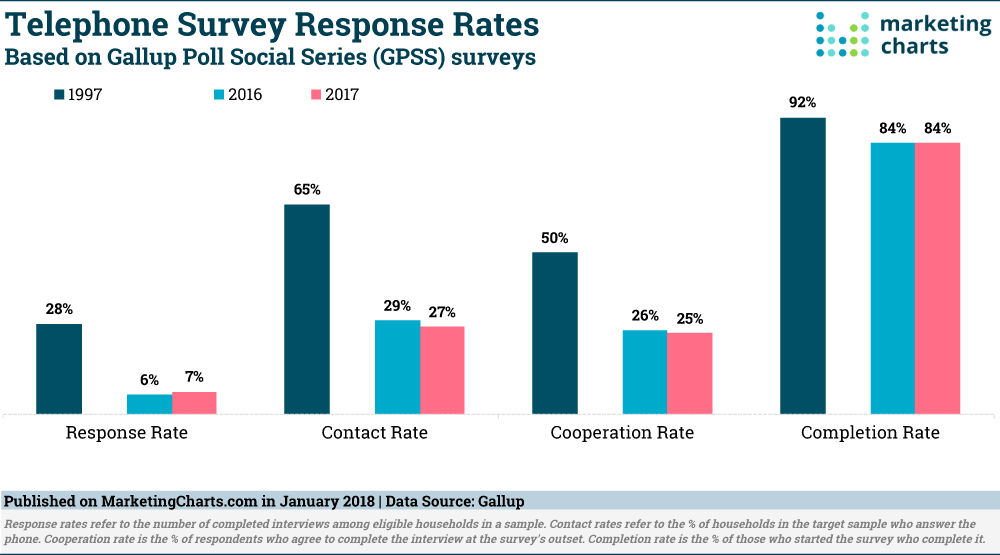
Telephone survey response rates have plummeted over the past 20-odd years, but may have reached their floor, according to a Gallup study whose results are supported by other research. Gallup’s data indicates that response rates for its Gallup Poll Social Series plunged from 28% in 1997 to a low of 5% in 2015, before increasing a couple of points to 7% last year.
Read MoreInfluencer Marketing Tools [INFOGRAPHIC]

This infographic by Izea illustrates influencer marketing tools and provides tips on how to use them.
Read MoreTop Social Video Platforms [VIDEO]
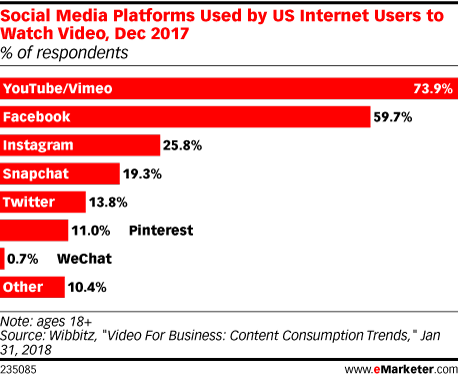
New research from artificial intelligence-powered video creation service Wibbitz provides some insight into which social media platforms video advertisers should be paying attention to—and it’s pretty much what you would expect.
Read MorePreferred Platforms By Social Influencers [CHART]
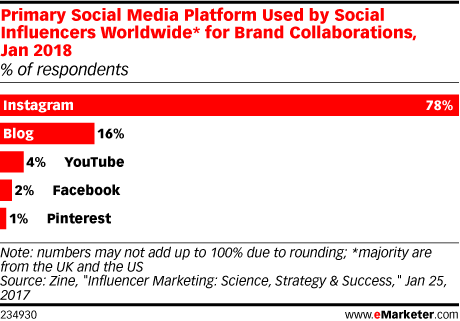
A new survey of social influencers worldwide from influencer platform Zine found that nearly 80% of respondents considered the Instagram to be their primary way of collaborating with brands.
Read MoreConsumer Expectations Over Brands Taking Political Stands By Issue [CHART]
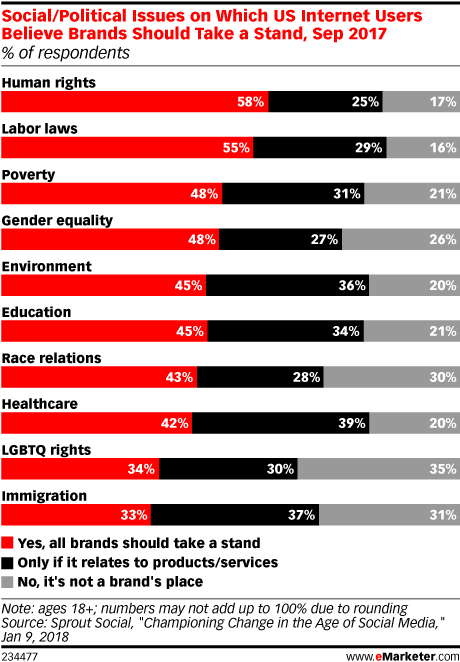
Sprout Social surveyed some 1,000 US internet users last September to find that two-thirds want brands to take a stand on social and political issues.
Read MoreStreaming Video By Age Group, 2015-2017 [CHART]
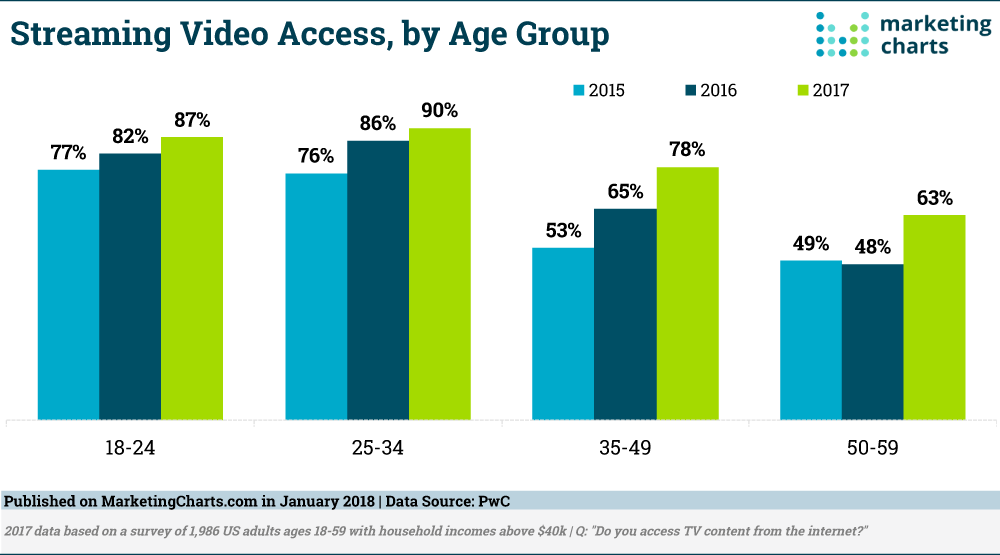
Streaming video has been popular with Millennials for some time, but it’s middle-aged Americans who are now getting in on the act. Almost 8 in 10 adults ages 35-49 accessed TV content from the internet in 2017, up from 53% just a couple of years earlier.
Read MoreWhat Smart Speaker Owners Would Like From Brands [CHART]
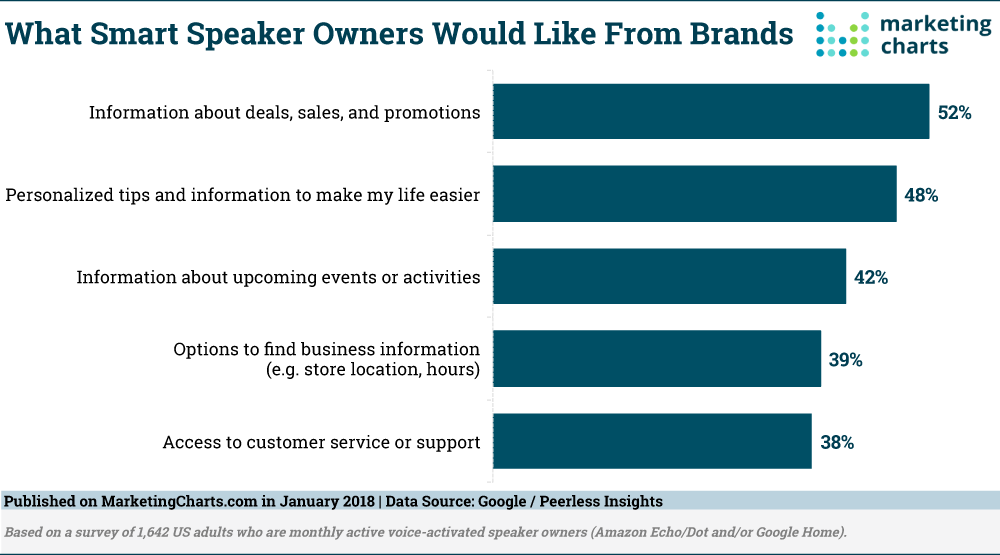
More than one-quarter of Alexa owners have asked their device about deals, recent research has revealed. Now, new data from Google and Peerless Insights indicates that Smart Speaker owners are most interested in receiving information about deals, sales and promotions from brands.
Read MoreWeb Survey Response Rates [CHART]
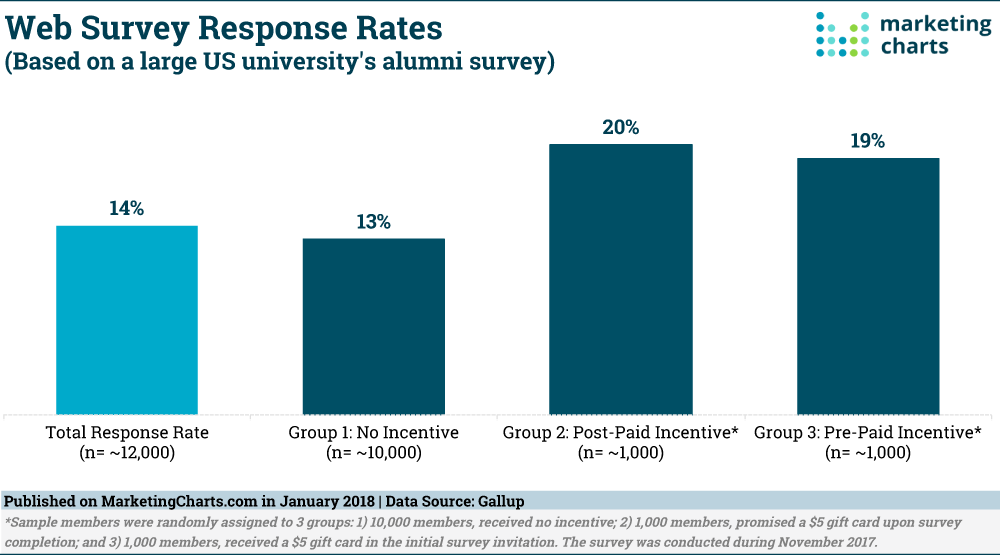
Garnering survey responses can be a notoriously challenging task, facing headwinds such as general dissatisfaction with market research and survey fatigue. Consider that telephone survey response rates plummeted from 36% in 1997 to just 9% in 2012.
Read MoreTop US Metro Areas By Public Transit Use [CHART]
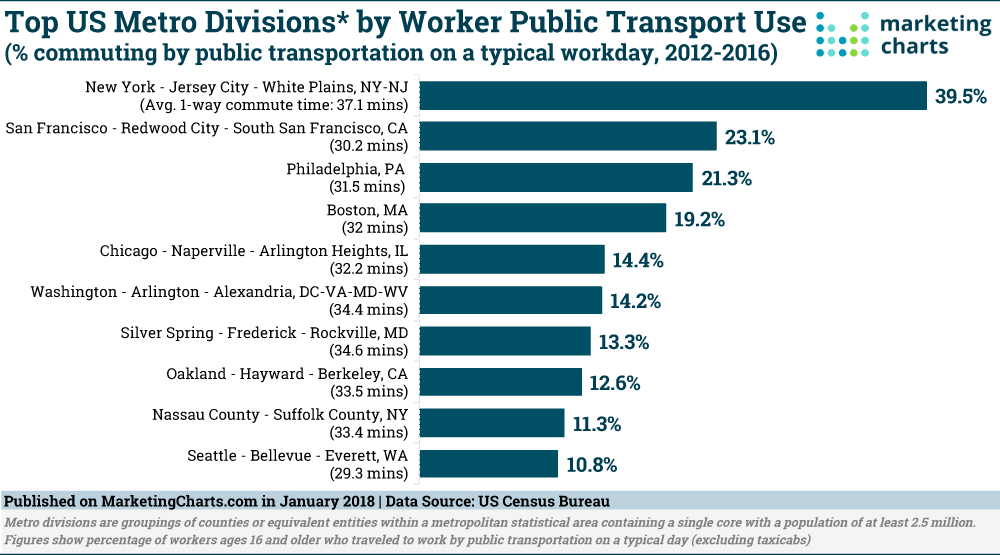
About 7.5 million workers – or 5.1% of the workforce – commutes by public transportation on a typical workday. But in some metro areas commuting rates are far higher.
Read More