Video
TV Viewing Times By Device, June 2013 [TABLE]
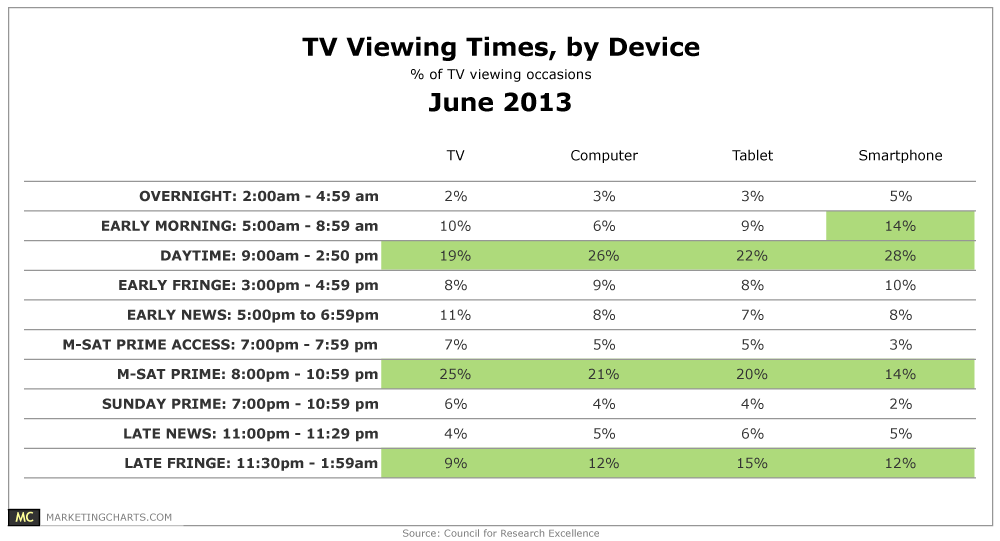
A plurality of tablet (22%) and smart phone (28%) TV viewing occasions tracked occurred during the daytime, between 9 AM and 3 PM.
Read MoreGlobal Entertainment & Media Content Spending, 2008, 2013 & 2017 [CHART]
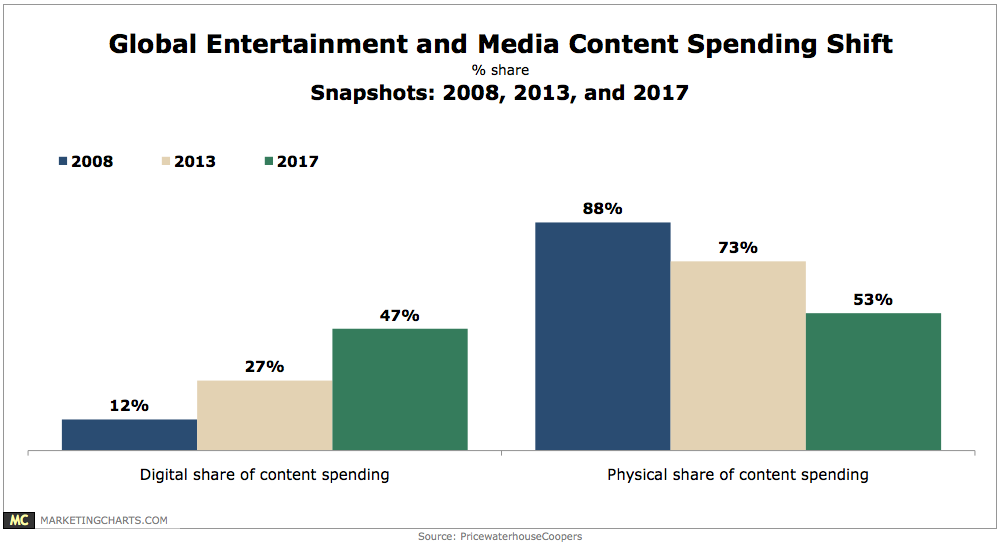
While physical purchases represented 88% of total spending on Entertainment & Media content in 2008, that number has dropped to 73% this year, and will fall to 53% by 2017.
Read MoreAttention Online Shoppers Pay To Retailers’ Facebook Updates, June 2013 [CHART]
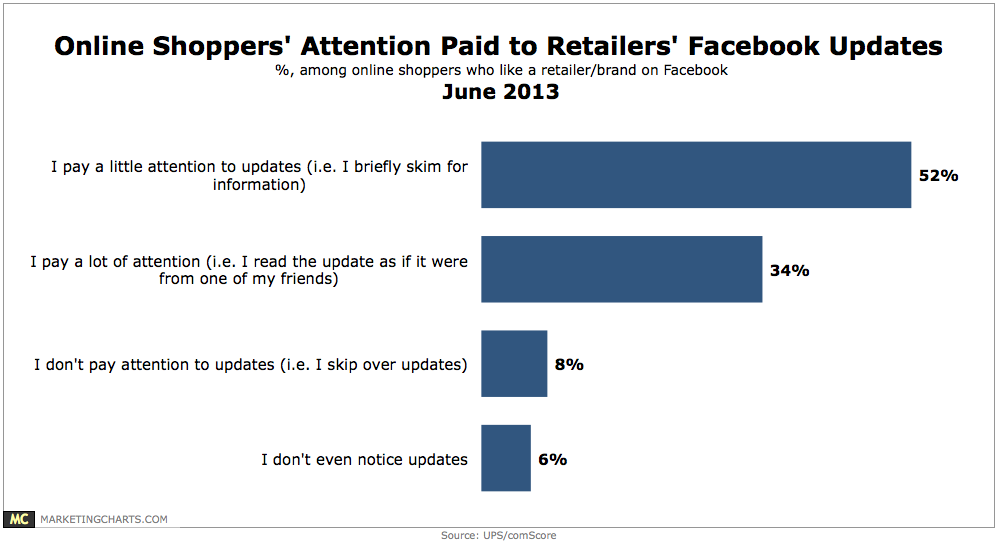
Just 14% of respondents either skip over retailers’ updates (8%) or claim to not notice them at all (6%).
Read MoreSmart Phone Market Penetration, October 2011 – April 2013 [CHART]

During the 3-month period ending in April 2013, comScore says that the share of mobile subscribers with a smartphone was essentially flat from March, at 58%.
Read MoreAmericans Who Click On Search Engine Ads By Age, August 2012 [CHART]
US internet users in the 18-to-34 age bracket were much more likely than older respondents—30% vs. 18%—to have clicked on ads in search engines.
Read MoreAmerican Digital Media Buying Penetration By Generation, 2013 & 2017 [CHART]
95.2% of US millennial adults are estimated to be mobile phone users by the end of the year.
Read MoreOnline CPG Shoppers' Behavior By Age, Q4 2012 [TABLE]
45% of the 18-to-34 cohort (vs. 27% of baby boomers) agreed that they “buy brands on sale vs. preferred brands” when shopping for CPG items.
Read MoreInfluence Of Shipping Costs On Online Shoppers, June 2013 [TABLE]
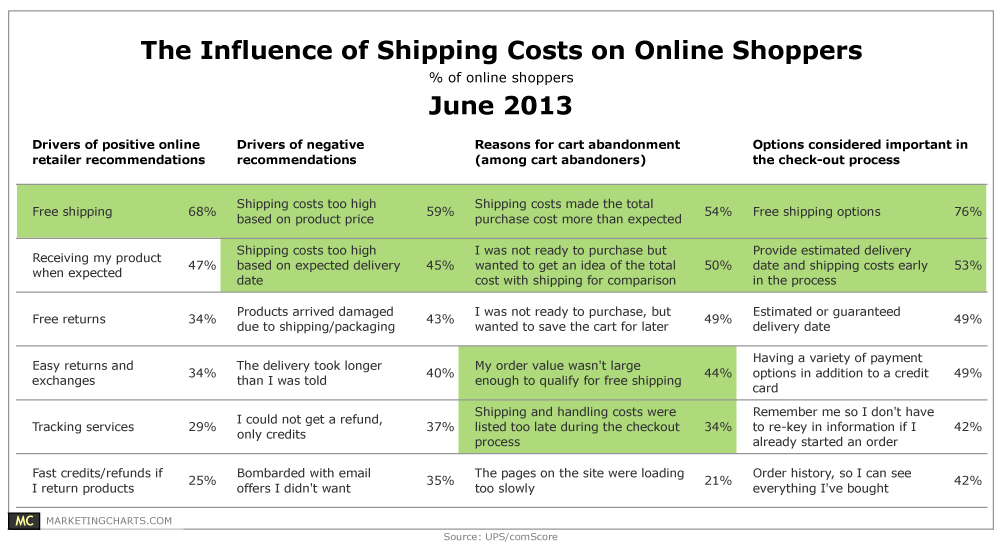
When asked their top drivers of positive recommendations for an online retailer, a leading 68% of respondents cited free shipping, easily the top answer.
Read MoreNewspaper Circulation & Advertising Trends By Region, 2012 [CHART]
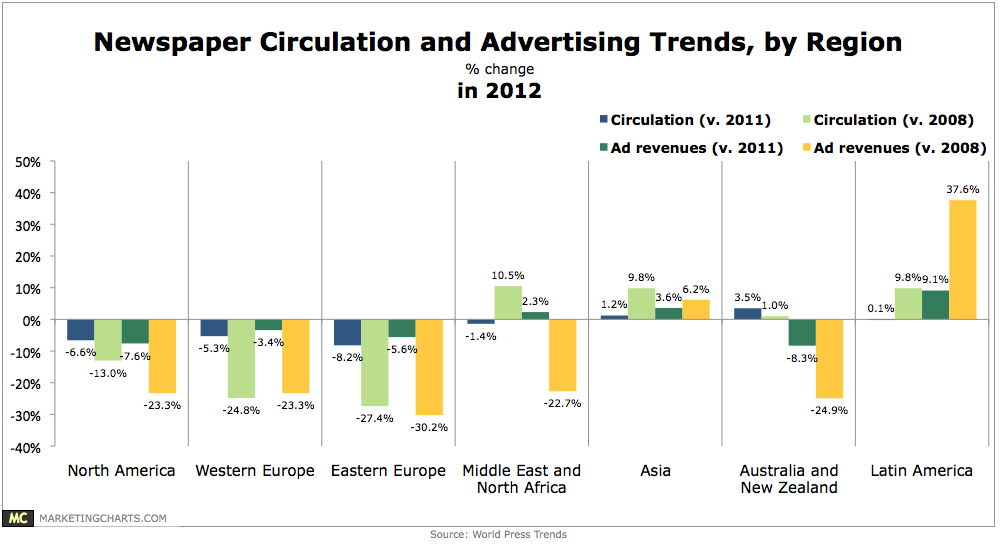
Newspaper circulation around the world dropped by only 0.9% in 2012, as losses in North America and other regions were almost completely offset by gains in Asia.
Read MoreTelevision Consumption By Device, June 2013 [CHART]
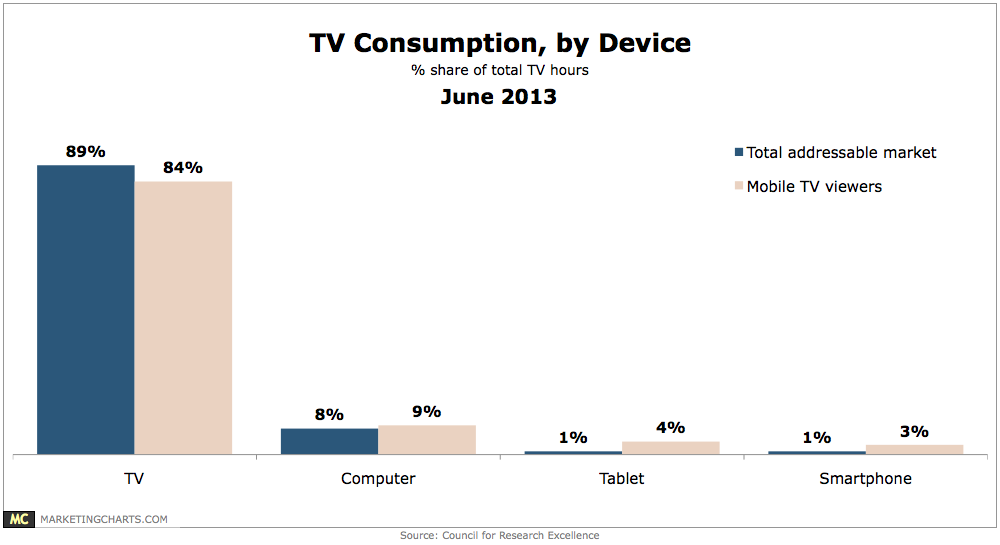
Just 2% of all TV hours logged were on tablets (1%) or smart phones (1%).
Read More