Video
Dayparting On Facebook, Instagram & Twitter [INFOGRAPHIC]
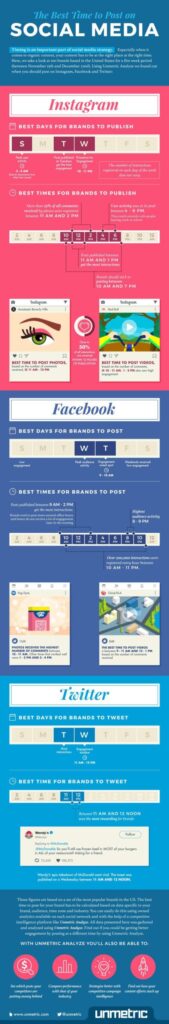
This infographic by Unmetric is based on an analysis of 100 U.S. brands and their social media activity, illustrating the best time to post on Facebook, Instagram and Twitter. Keep in mind the mileage will vary and the best approach is to pay close attention to when your audience is active on these platforms.
Read MoreEmployee Advocacy Programs [INFOGRAPHIC]
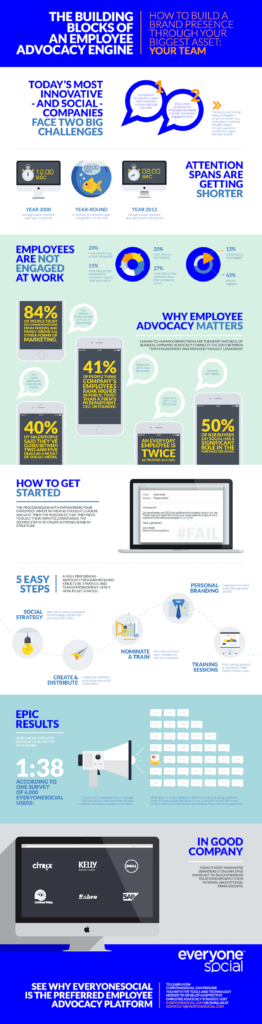
This infographic from EveryoneSocial illustrates the factors involved in building an employee advocacy program.
Read MoreMultitainment Users By Device, 2015-2019 [TABLE]
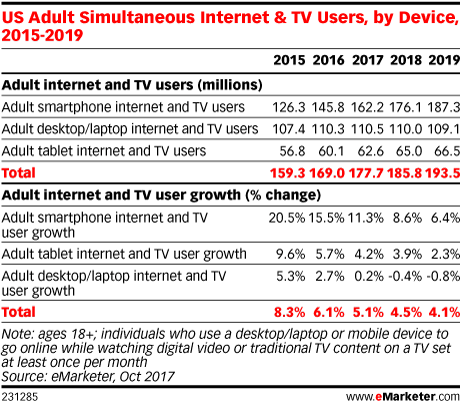
The simultaneous use of second-screen devices—smartphones, tablets and desktops/laptops—while watching TV has increased year to year and will continue through at least 2019.
Read MoreAwareness Of Biometric Technologies [CHART]
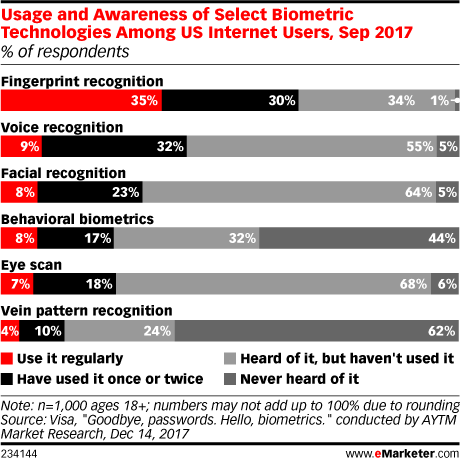
Many consumers are likely not running out to buy a device with biometrics because such devices are pricey. Indeed, Apple’s iPhone X is the manufacturer’s most expensive device to date.
Read MoreConsumer Attitudes Toward Facial Recognition [CHART]
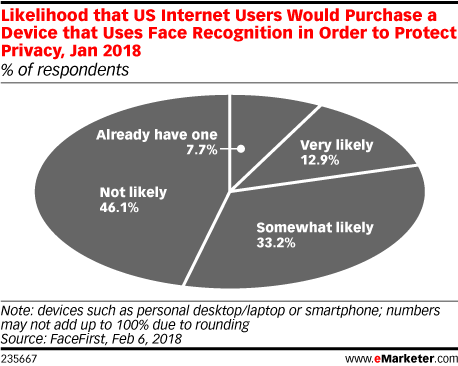
Some 46.1% of respondents said they were not likely to purchase a device with facial recognition to help protect their privacy, while 46.1% said they were at least somewhat likely to buy one.
Read MoreWhy People Stream Video [CHART]
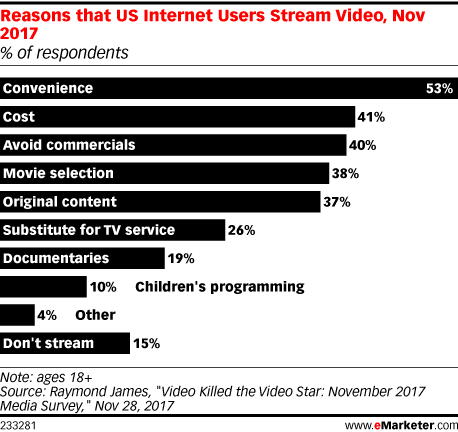
The dramatic rise of Netflix and other over-the-top (OTT) video services has fundamentally changed viewing habits in the US, especially among younger users, but in the short run it can be easy to overrate that change.
Read MoreVisual Marketing [INFOGRAPHIC]

This infographic from iScribblers illustrates five ways humans are wired for visual stimuli.
Read MoreSocial Media Engagement Best Practices [INFOGRAPHIC]
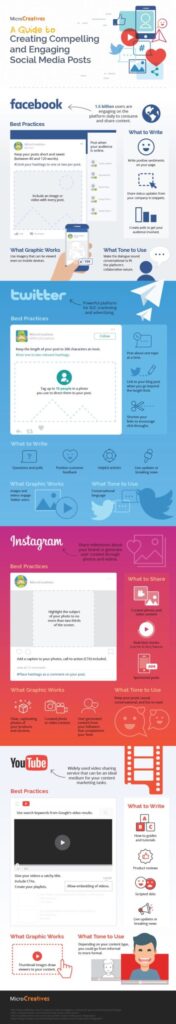
This infographic from Micro Creatives highlights best practices for social media engagement on Facebook, Twitter, Instagram and YouTube.
Read MoreVideo Game Console Ownership By Age [CHART]
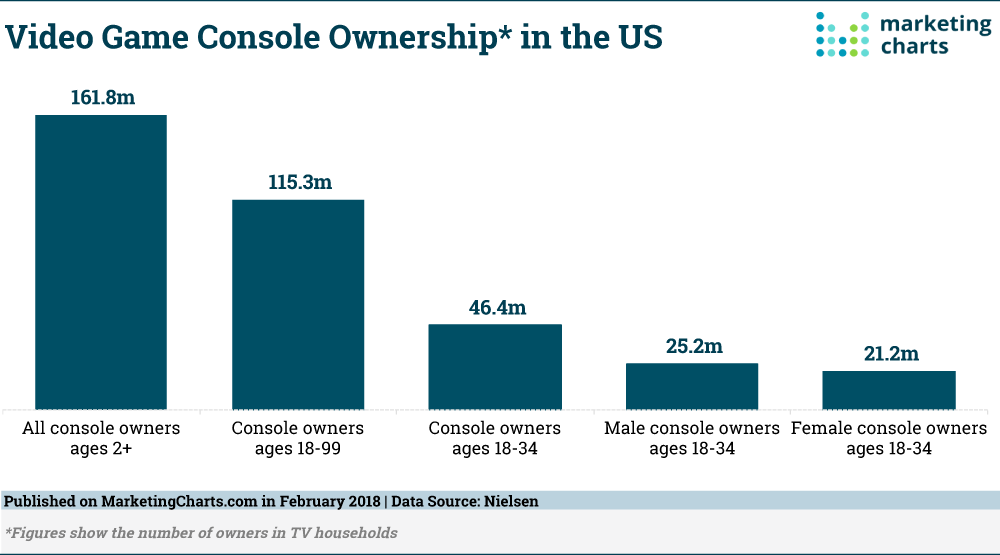
Video game hardware sales grew by 19% last year to reach $6.9 billion, per a recent report from the Entertainment Software Association. So how many Americans actually own video game consoles? Nielsen provides some answers.
Read MoreConsumer Benefits Of Chatbots [CHART]
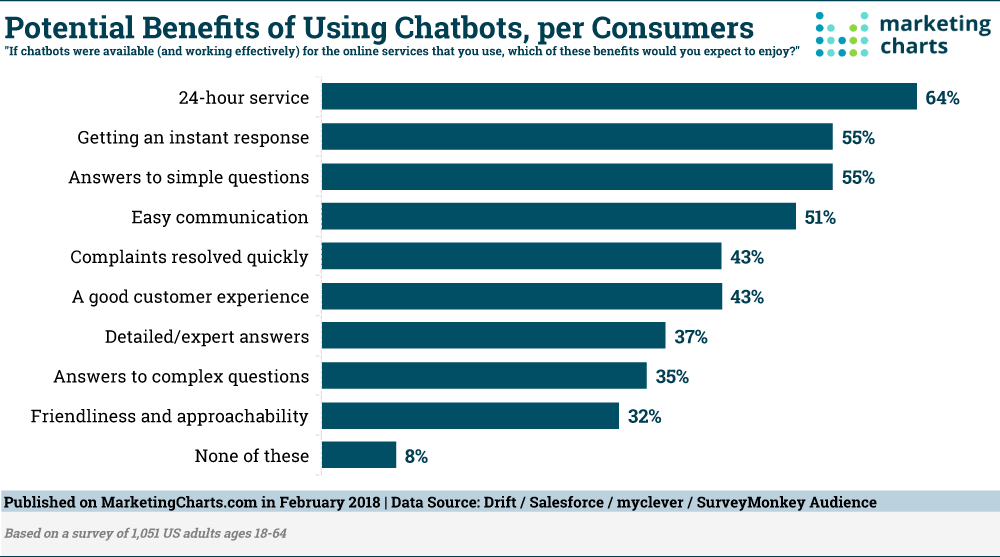
Chatbots are expected to be able to help round-the-clock with instant service for simple tasks, but aren’t perceived to be the best channel for more complex inquiries. Chatbots have yet to find broad appeal among consumers, though they do have a user base: 15% have used them to communicate with businesses during the past year.
Read More