Video
Primary Reason People Use Mobile Health & Fitness Apps, March 2014 [CHART]
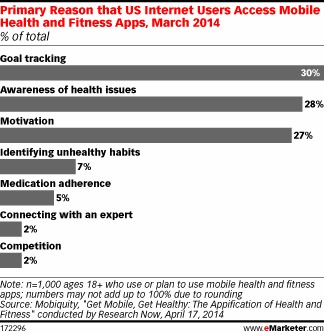
Goal tracking was the No. 1 reason for accessing mobile health and fitness apps, cited by three in 10 internet users who used or planned to use them.
Read MoreFrequency Of Mobile Health & Fitness App Use, March 2014 [CHART]
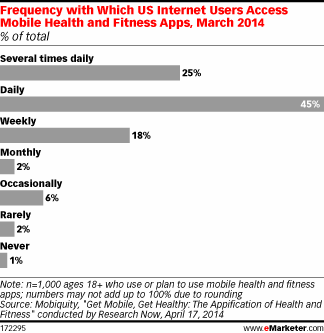
70% of respondents accessed or planned to access health or fitness apps at least daily.
Read MoreChange In SEO Effectiveness According To Marketers, April 2014 [CHART]
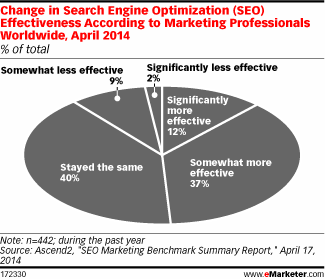
Nearly half of the professionals polled said that SEO marketing had become at least somewhat more effective during the prior year.
Read MoreMarketers' Use Of Social Media vs Normal People [INFOGRAPHIC]
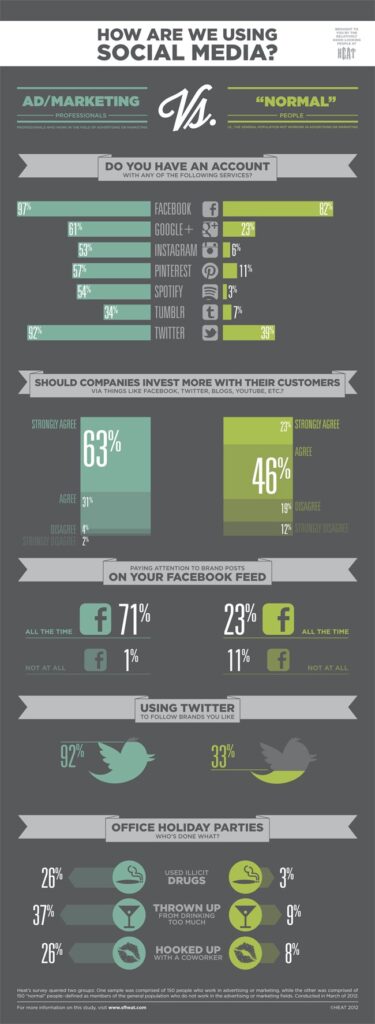
This infographic from SFheat illustrates survey results showing how marketers use social media versus normal people.
Read MoreMarketers’ Satisfaction With Word-Of-Mouth & Social Media Tactics, April 2014 [CHART]
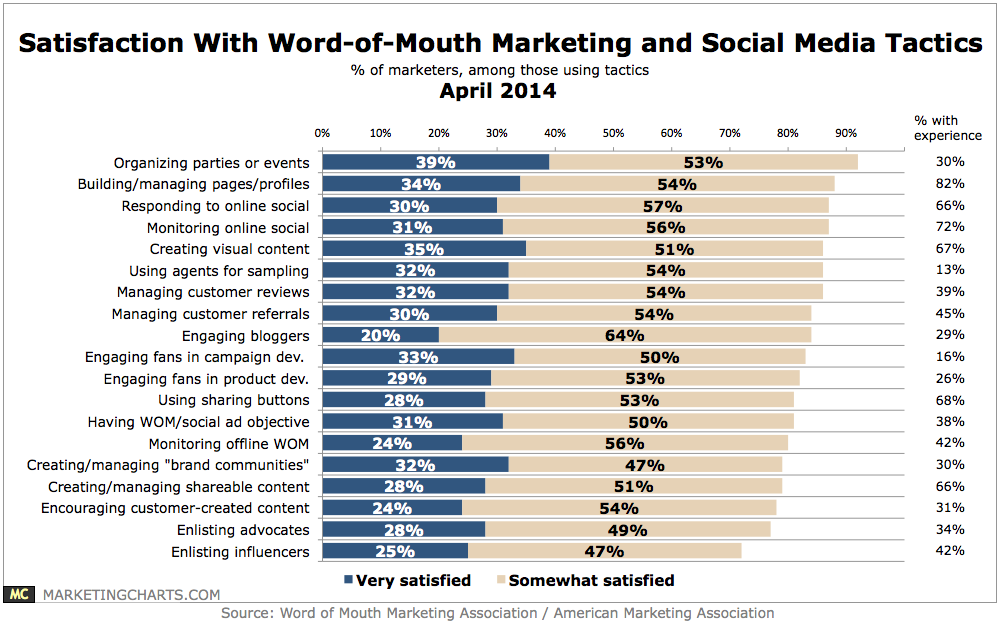
About 9 in 10 marketers indicate that difficulty measuring offline word-of-mouth (W-O-M) marketing is an obstacle in pursuing a W-O-M strategy at their companies, and 8 in 10 concur with respect to difficulties measuring online social media marketing.
Read MoreSocial Login Trends, Q1 2012 – Q1 2014 [CHART]
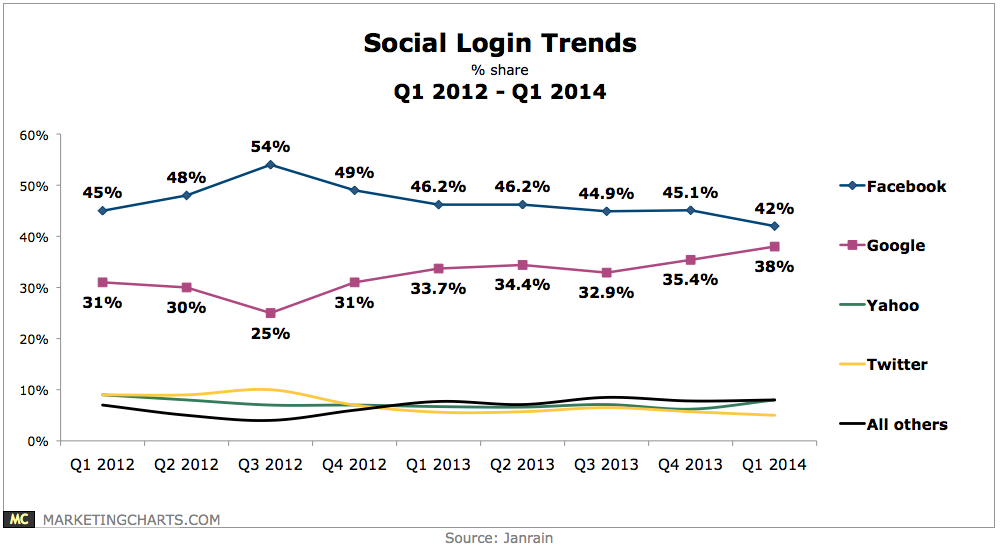
Google’s share of social logins grew to 38% in Q1 2014, marking its highest point in 3-and-a-half years.
Read MoreMobile Video Ad Benchmarks By Length & Format, April 2014 [CHART]
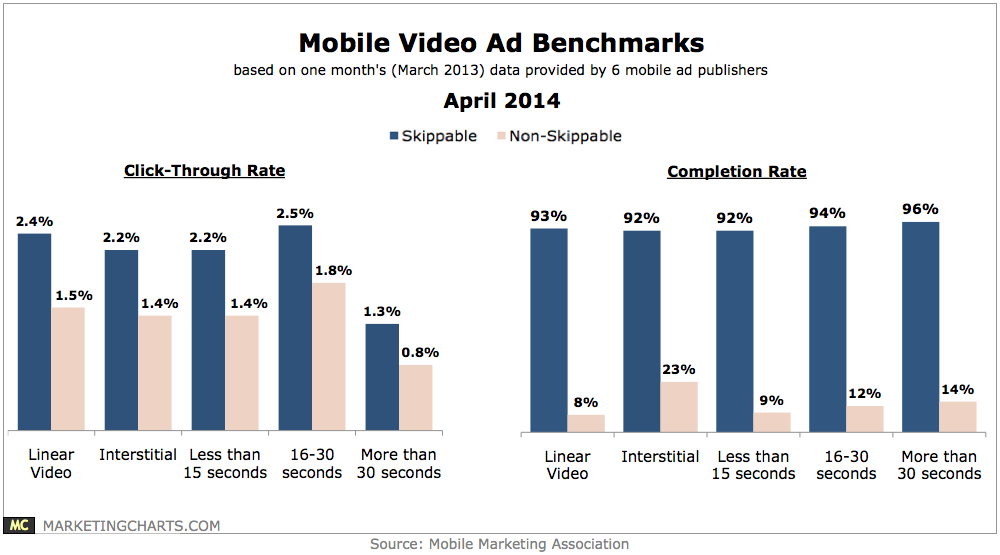
Completion rates for non-skippable video ads topped 90% for each of the formats measured – linear video (93%); interstitial (92%); and value exchange (97%).
Read MoreUK Average Weekly Mobile Banking Transactions, 2012 & 2013 [CHART]
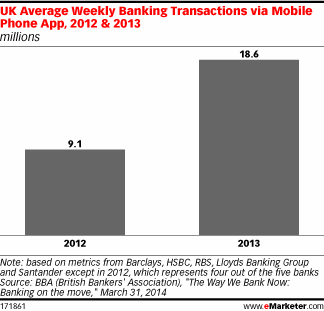
BBA found that the average number of mobile banking transactions conducted weekly via mobile app more than doubled between 2012 and 2013, from 9.1 million to 18.6 million.
Read MoreGeneration V's Most Popular Online Activities By Gender, March 2014 [CHART]
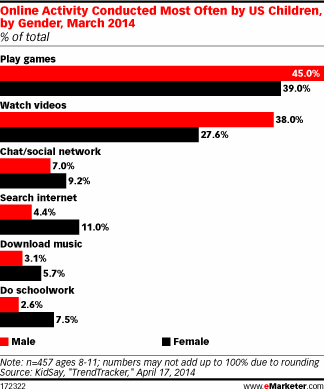
Playing games was the online activity conducted most often by US children, cited by 45.0% of boys and 39.0% of girls.
Read MoreFrequency Of American Children's Internet Use By Gender, March 2014 [CHART]
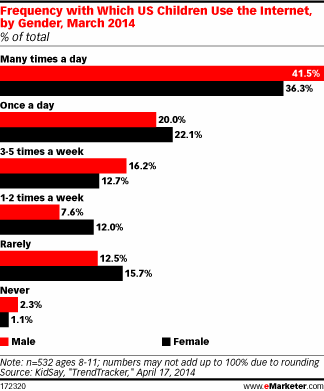
41.5% and 36.3% of 8-to-11-year-old US males and females, respectively, used the Internet many times a day.
Read More