Video
How People Buy Sporting Event Tickets, Q1 2014 [CHART]
Fully 37% of sports fans said they bought their tickets via mobile phone or tablet.
Read MoreFrequency Of Arranging Sporting Event Plans Via Mobile, Q1 2014 [CHART]
44% of US mobile phone users planned to go to a live sporting event this year, with football, basketball and baseball the most popular.
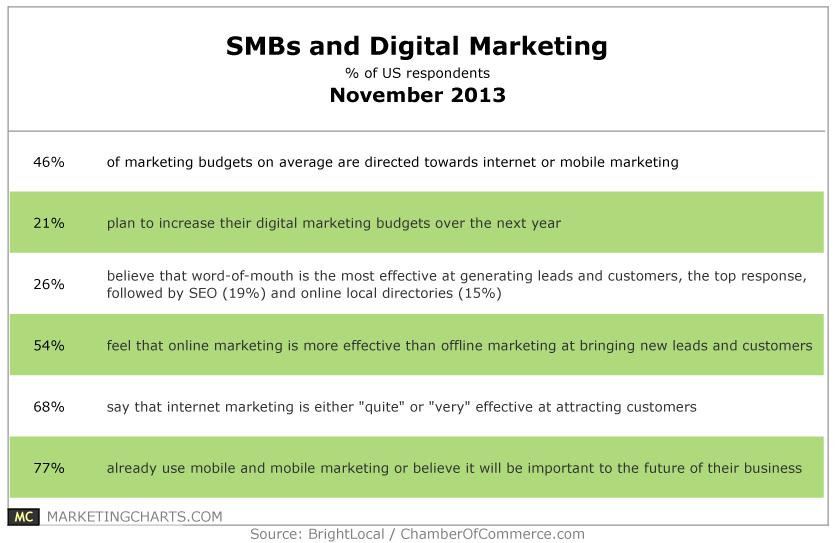
Read MorePopular Types Of Video, August 2014 [CHART]
Roughly 6 in 10 US adults say they watch videos when they visit a brand website with video content, and 4 in 10 prefer watching a brand video over reading the same information.
Read MoreEffect Of Data Breaches On Customer Loyalty, August 2014 [CHART]
A financial data breach would turn some consumers away from a business for good.
Read MoreFacebook Brand Response Rates, Q2 2012 – Q2 2014 [CHART]
Brands around the world responded to an average 67% of users’ wall questions in Q2, inching up from the previous peak of 65% set in Q1.
Read MoreTrust In Online Reviews By Reading Frequency, June 2014 [CHART]
88% of internet users said they trusted online reviews about local businesses as much as suggestions from people they knew, up from 79% last year.
Read MoreEmail Metrics By Daypart, Q4 2013 [TABLE]
Emails sent during the nighttime hours of 8pm to 12am saw the highest unique open rates, click rates, transaction rates and revenue per email.
Read MoreEmail Marketing Metrics By Day Of Week, Q4 2013 [TABLE]
Saturday had the highest open rates and average order sizes compared with all other days.
Read MoreShare Of Email Campaigns Sent By Day Of The Week, January 2014 [CHART]
The majority of marketers opt to send emails during the week.
Read MoreShoppers' Top In-Store Mobile App Activities, April 2014 [CHART]
Price-related activities were the top reasons for mobile shopping app usage while in brick-and-mortar stores.
Read More