Video
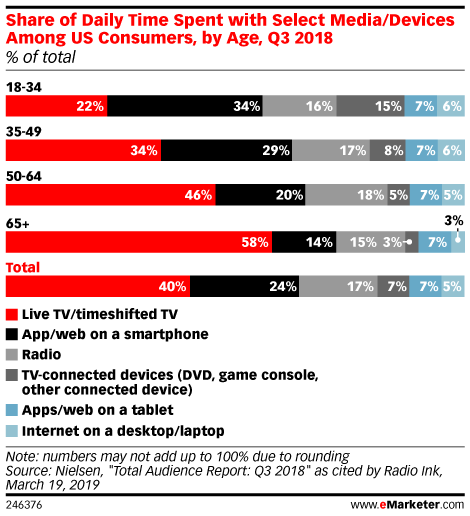
Media Consumption By Device Age Range [CHART]
According to Q3 2018 research from Nielsen, US consumers ages 35 to 49 spend nearly the same amount of time with old media like live and timeshifted TV and radio, as with their digital devices by accessing apps and the web on a smartphones or tablet.
Read MoreSocial Video [INFOGRAPHIC]
This infographic from Animoto illustrates how users respond to video on the top social media platforms.
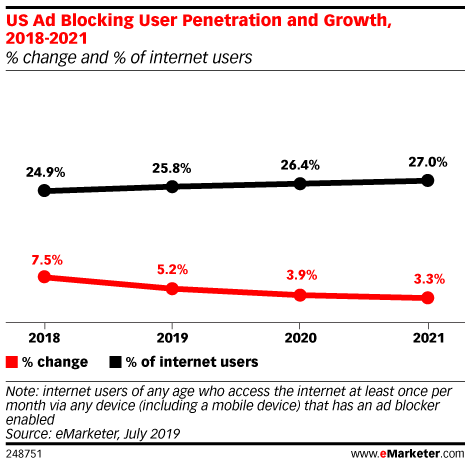
Read MoreAd Blocking User Growth, 2018-2021 [CHART]
Fewer internet users than expected are blocking ads across the US and Western Europe. For the second year in a row, eMarketer downgraded their estimates of the ad blocking population in France, Germany, the UK and US, as well as their forecast for future growth.
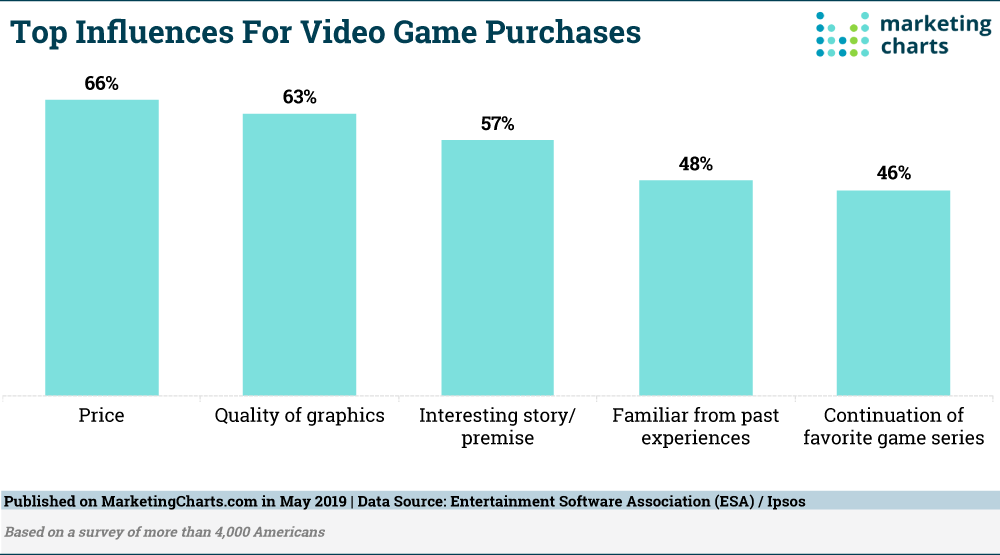
Read MoreTop Video Game Purchase Factors [CHART]
About two-thirds (65%) of US adults play video games and three-quarters of Americans have at least one gamer in their household. So, with the Entertainment Software Association (ESA) reporting that US gamers spent a total of $43.4 billion last year on games, hardware and peripherals, who are these individuals and what influences them when buying games?
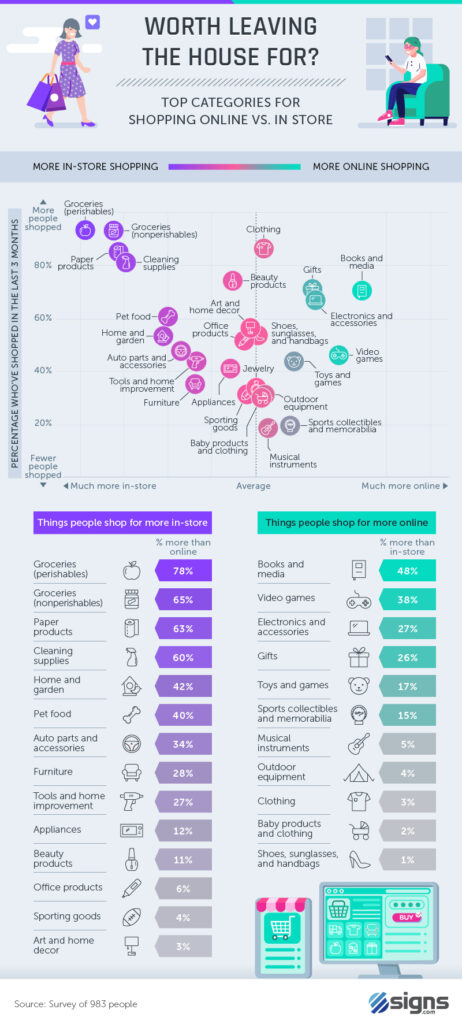
Read MoreTop Shopping Categories [INFOGRAPHIC]
This infographic from signs.com illustrates which retail shopping categories are most popular online versus in brick and mortar stores.
Read MoreTop Mobile Apps, 2019 [CHART]
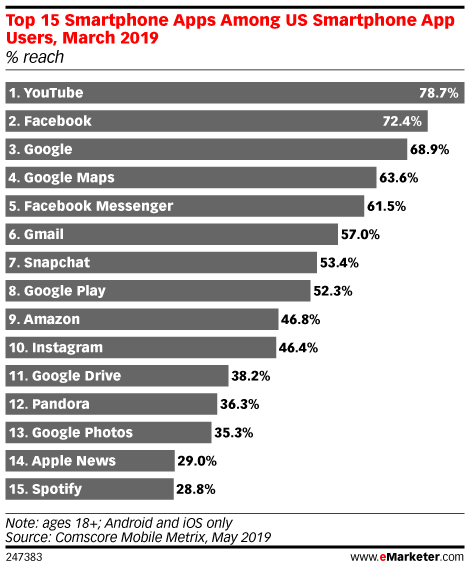
Of the 15 most popular mobile apps, Google owns seven of them; Facebook owns three and Apple only one.
Read MoreMap App Users, 2017-2021 [CHART]
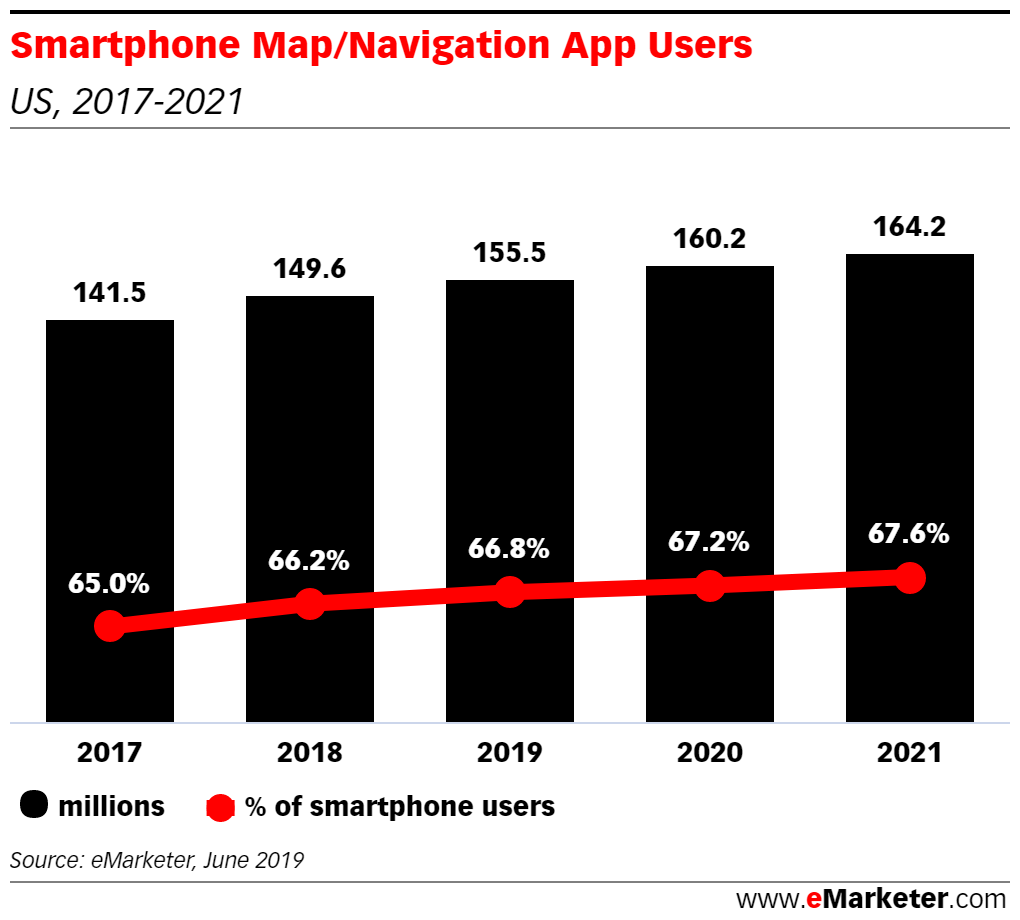
Maps and navigation apps are essential tools for smartphone users, and we forecast that 66.8% of smartphone users will use them monthly, with a growth of 5.8% from 2017 to 2018. More than 155 million people will use maps and navigation apps by the end of this year. We expect that growth will remain steady in the coming years, and penetration will reach 67.6% by 2021.
Read MoreVoice Assistant User Penetration [CHART]
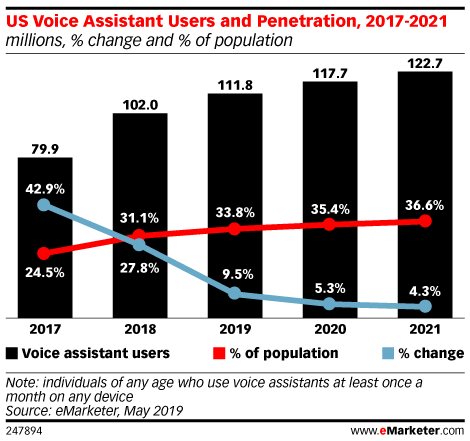
In 2017, nearly 80 million Americans used a voice assistant at least once a month on any device; that number is expected to reach 123 million by 2021, constituting 36.6% of the United States population, according to eMarketer.
Read MoreShopping Online vs In-Store [INFOGRAPHIC]
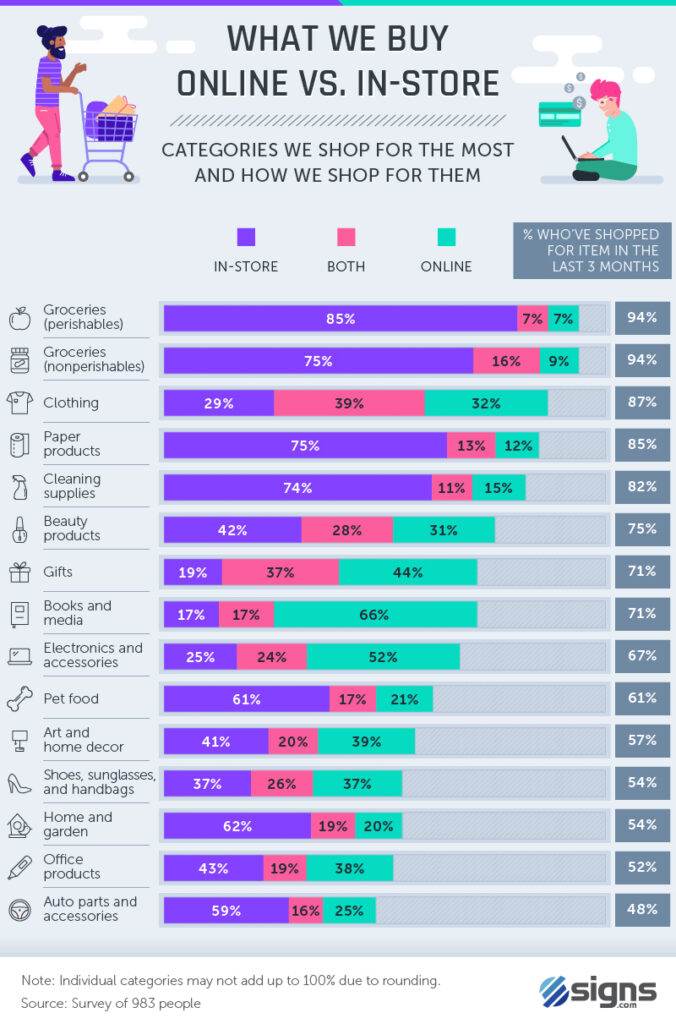
This infographic from signs.com illustrates what people buy online, in-store, and both by 15 different categories.
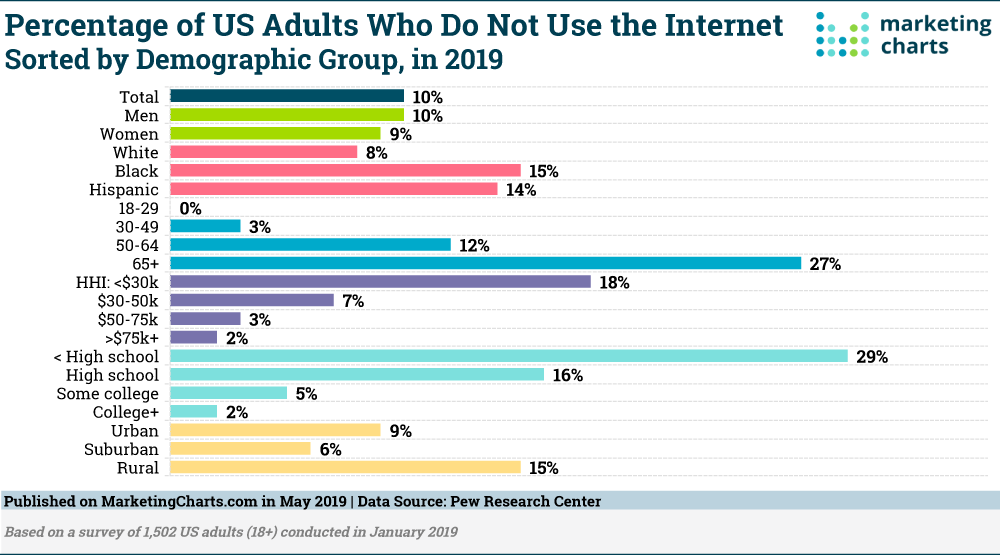
Read MoreDigital Nevers [CHART]
The proportion of US adults who do not use the internet continues its slow decline, per data from the Pew Research Center, as the percentage of the US adult population who do not use the internet has more than halved in fewer than 10 years.
Read More