Video
Mobile App YoY Usage Growth in 2014 [CHART]

Mobile application usage – defined as a user opening an app and recording a session – increased by 76% year-over-year.
Read MoreTop Content Needs For IT Decision-Makers By Purchase Stage, January 2015 [TABLE]
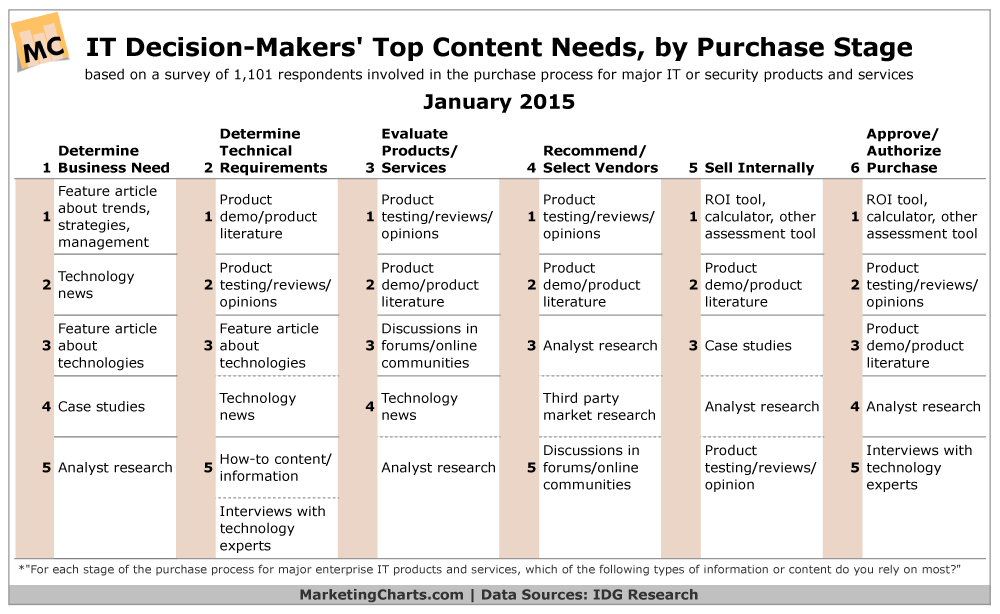
IT decision-makers tend to rely on news articles and product demos early on in the purchase process, turning to product testing and reviews during the vendor evaluation and selection stage, and ROI and other assessment tools to sell internally and authorize the purchase.
Read MorePenetration Of On-Demand Video Services, 2013 vs 2014 [CHART]
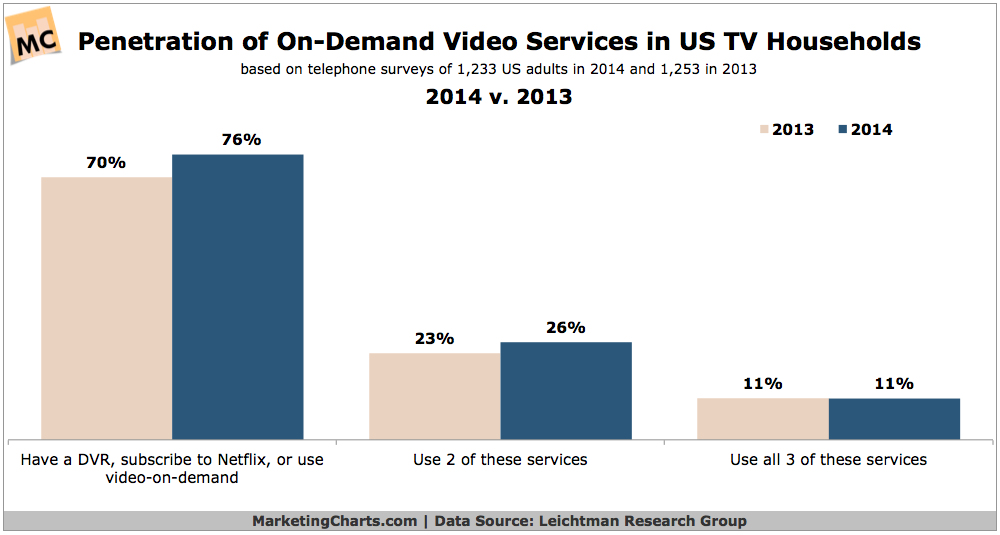
3 in 4 TV households in the US now have a DVR, subscribe to Netflix, or use video-on-demand (VOD) services from a cable or telco provider.
Read MoreTop Work Technologies, January 2015 [CHART]
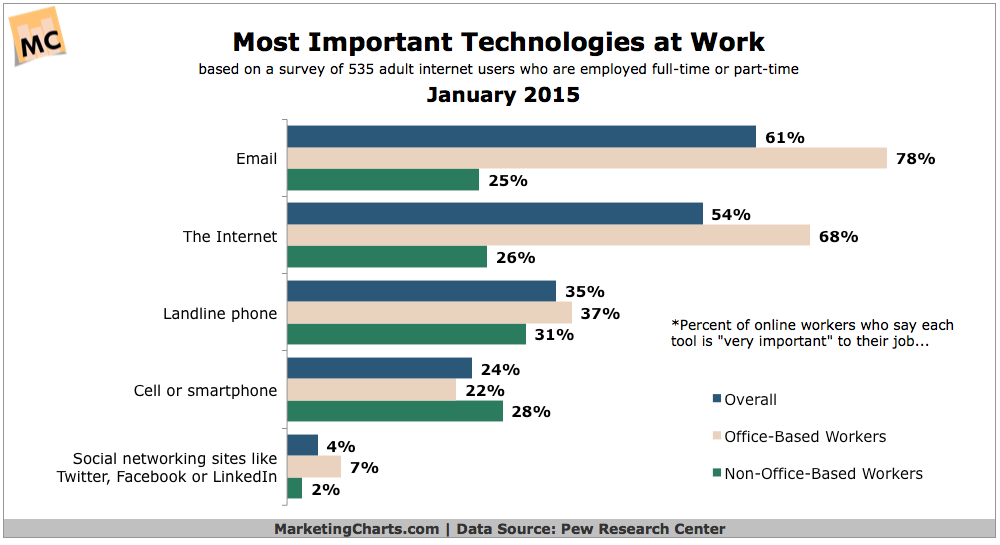
Email (61%) beats the internet (54%) and landline phones (35%) as the most important technology for working internet users.
Read MoreGlobal Smart Device Shipments By Type, 2013-2018 [TABLE]
The number of global shipments of phablets are expected to pass tablets shipped worldwide in 2015 for the first time.
Read MoreNew Smart Devices Activated Christmas Week By Type, 2012-2014 [CHART]
Phablet devices activated worldwide during the week of Christmas accounted for 13% of total activations—up 225% year over year.
Read MoreTop 5 Smart Device Brands Activated During Christmas Week, 2014 [CHART]
Apple accounted for 51.3% of device activations between December 19 and 25, 2014.
Read MoreMagazine Industry Social Media Like/Follower Share By Network, October 2014 [CHART]
Facebook’s share of Likes and Followers worldwide of US magazine brands on social networks was nearly 50%.
Read MoreUnique Visitors To Financial Services Facebook Pages, June & September, 2014 [TABLE]
Payment services maintained the highest number of monthly unique engaged visitors during the six months as the total more than sextupled.
Read MoreShare Of Social Engagement On Financial Service Brand Pages, October 2014 [CHART]
Nearly three-quarters (72%) of US financial services brands tracked on the Sharablee social analytics company’s platform had a social network presence.
Read More