Video
American Online Newspaper Website Visitors, 2013-2014 [CHART]
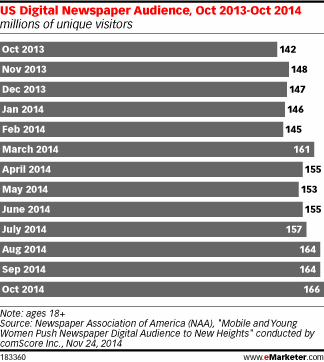
Total unique visitors to US newspaper websites rose 17% year over year to 166 million, compared with 142 million in October 2013.
Read MoreGlobal Tablet Users, 2013-2018 [CHART]
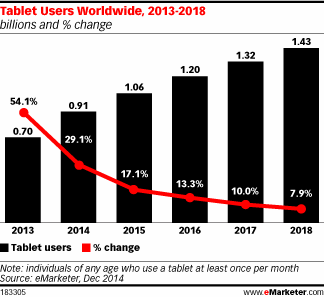
More than 1 billion people worldwide will use a tablet in 2015.
Read MoreMobile In-Store Research By Category & Device, March 2014 [CHART]

The desktop remains the device where even consumers with mobile devices spend the majority of their time when researching auto.
Read MoreShare Of Time Spent Consuming Content On Mobile By Category & Device, March 2014 [CHART]
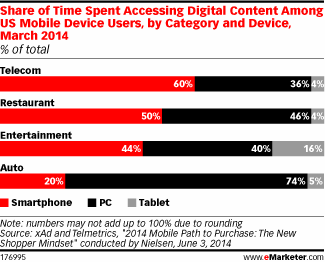
Mobile remains an area of distinct opportunity for dealer innovation, especially as consumers have yet to fully integrate mobile into the buying process.
Read MoreManual vs Automated Personalization, October 2014 [CHART]
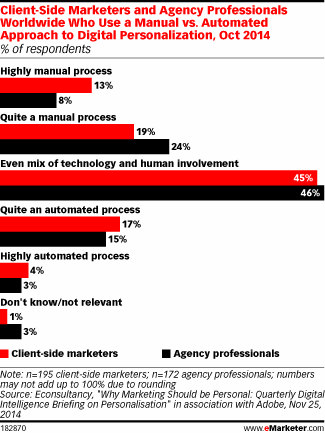
About 45% of client-side marketers as well as agency professionals used an even mix of tech and human involvement.
Read MoreMarketers' Approach To Personalization, October 2014 [CHART]
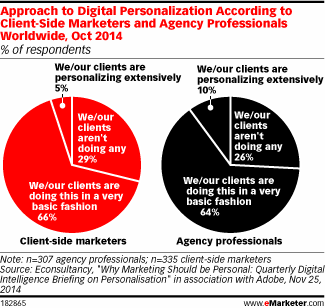
Just 5% of client-side marketers worldwide said they were personalizing extensively, and 10% of agency professionals said the same about their clients.
Read MoreMarketers' Planned Tech Spending, January 2015 [CHART]
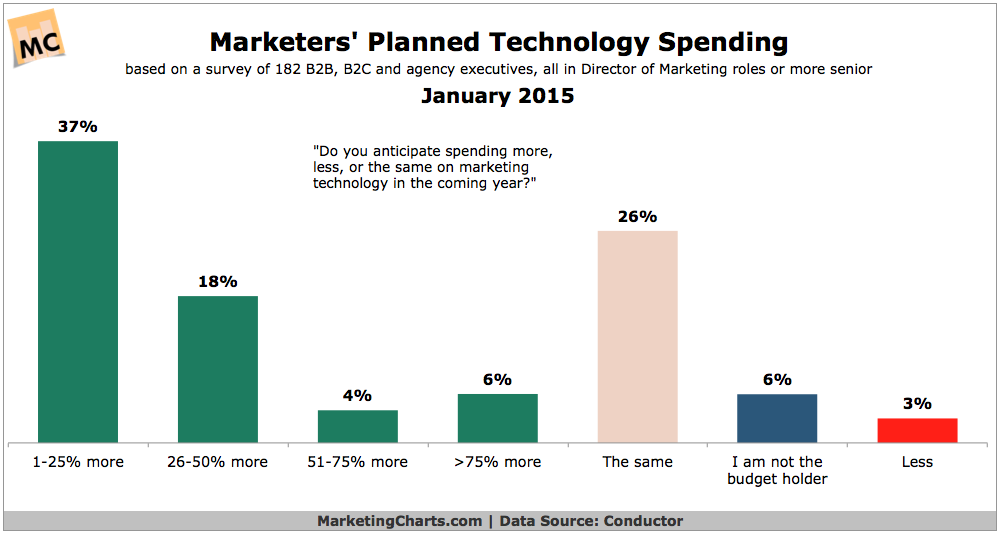
Some 65% of senior marketing executives anticipate spending more on marketing technology in the coming year.
Read MoreAmericans' Primary Video Viewing Sources In 2020 [CHART]
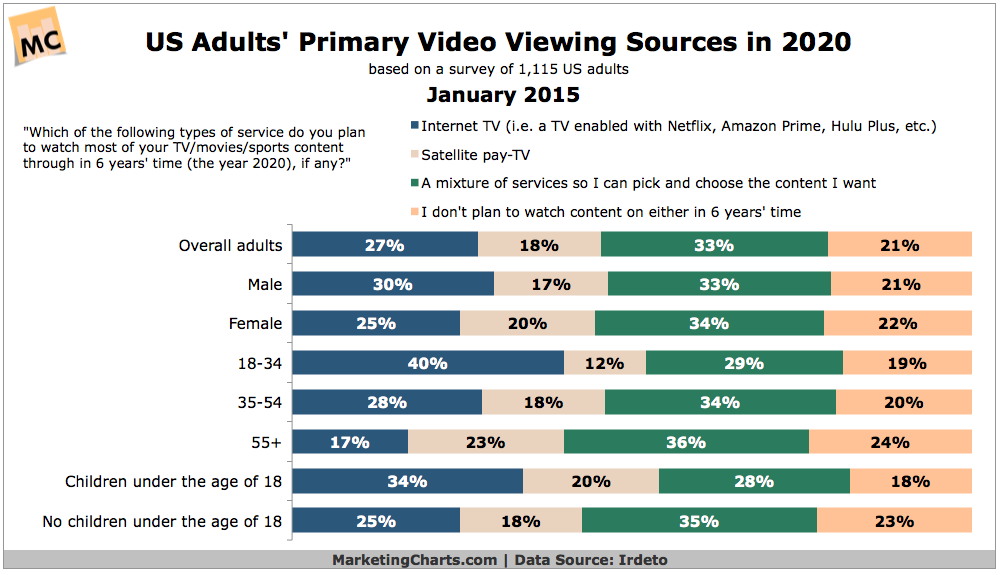
27% of Americans cited internet TV (a TV enabled with Netflix, Amazon Prime, Hulu Plus, etc.) as their primary video viewing source during the next 6 years.
Read MoreTeen Attitudes Toward Select Online Activities, October 2014 [CHART]
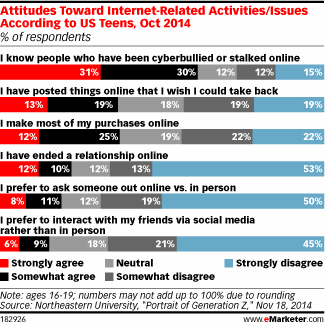
Some 81% of internet users between the ages of 13 and 22 feel their peers share too much online.
Read MoreGlobal Smart Phone Users & Penetration, 2013-2018 [CHART]
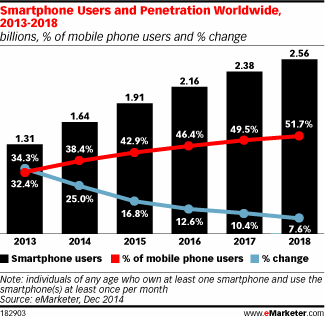
The number of smartphone users worldwide will surpass 2 billion in 2016.
Read More