Video
Top Mobile Content Consumed By Physicians
Specialty-specific or clinical content was the leading type viewed via mobile by US physicians.
Read MoreMobile Physicians, 2012-2015 [CHART]
Among US physicians polled, 84% reported using smartphones for professional purposes.
Read MoreMobile vs Desktop US Local Search Volume, 2014-2019 [CHART]
BIA/Kelsey reported that there would be 81.8 billion US local search queries conducted via mobile in 2015, up 23.0% over 2014.
Read MoreThe Cost Of Social Customer Service [INFOGRAPHIC]
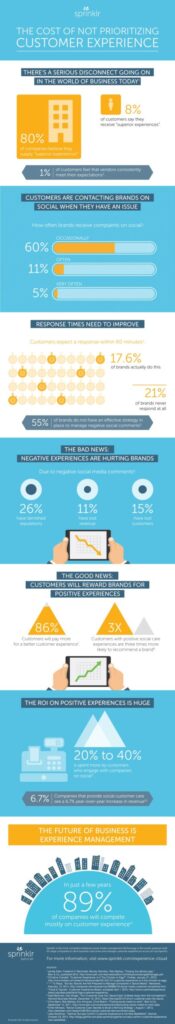
This infographic illustrates the costs of neglecting social customer service.
Read MoreState Of The Internet, 2015 [MARY MEEKER PRESENTATION]
Mary Meeker’s annual State of the Internet report was released today and, as usual, it is jam-packed with fascinating and useful stats on how we use online communications.
Read MoreNumber Of Podcasts People Listen To Weekly, February 2015 [CHART]
Weekly podcast listeners—estimated at approximately 27 million people—listened to an average of six podcasts per week.
Read MorePrimary Podcast Listening Device, 2014 vs 2015 [CHART]
Fully 55% of US consumers ages 12 and older who had ever listened to a podcast said they used a smartphone, tablet or portable audio player most frequently to do so.
Read MoreHow People Use Mobile Payments, May 2015 [CHART]
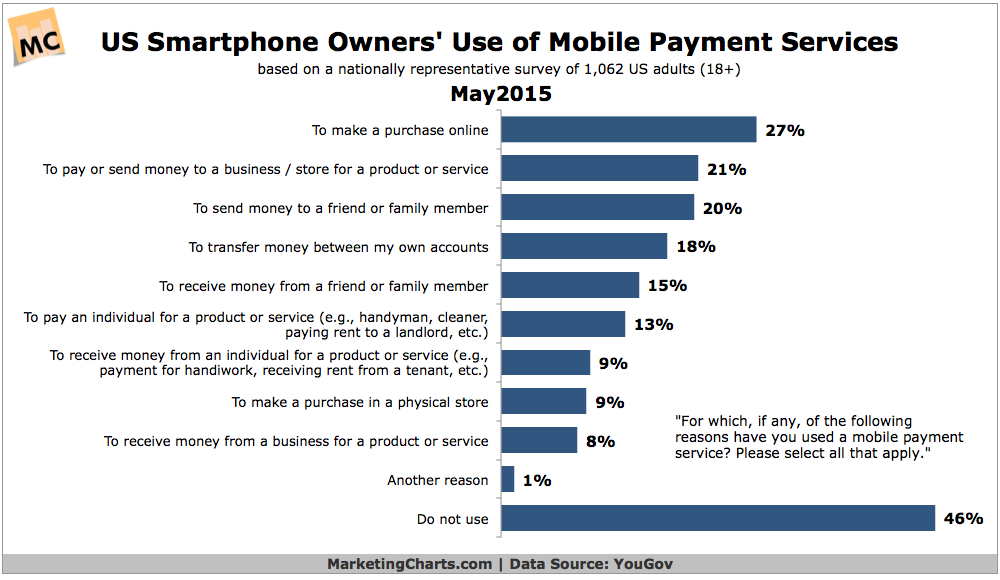
Some 91% of US adult smartphone owners have heard of a mobile payment service such as PayPal, Google Wallet and Apple Pay.
Read MoreSocial Video Advertising Metrics, April 2015 [CHART]
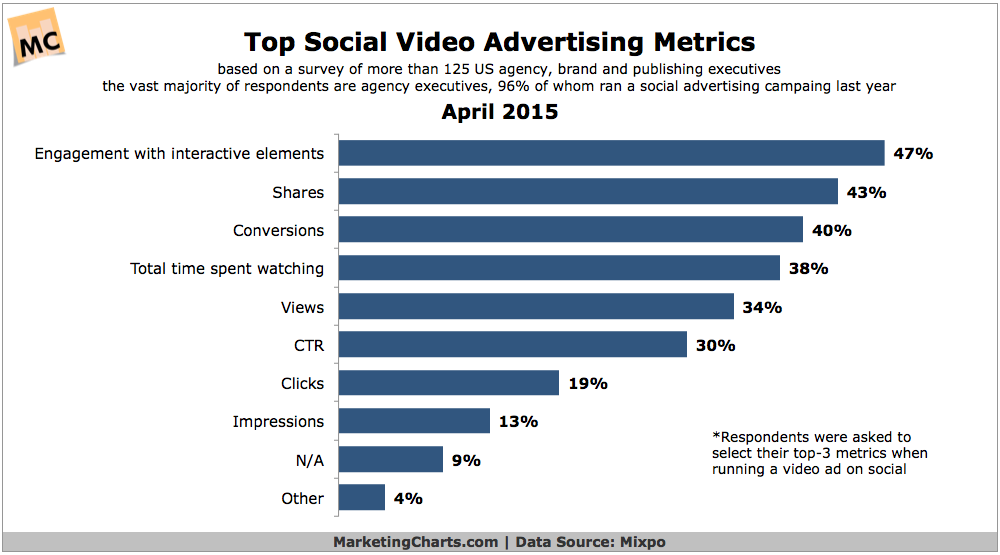
Advertisers running video ads on social media are more interested in metrics such as engagement with interactive elements and shares than they are with views.
Read MoreSwearing Customers [INFOGRAPHIC]
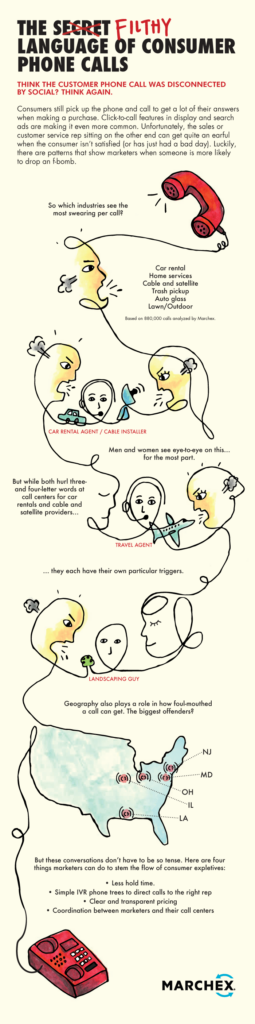
Swearing Customers Infographic: This infographic by Marchex illustrates the industries that earn the foulest-mouthed customers.
Read More