Consumer Behavior
Website Content Engagement By Desktop Or Mobile, August 2015 [CHART]
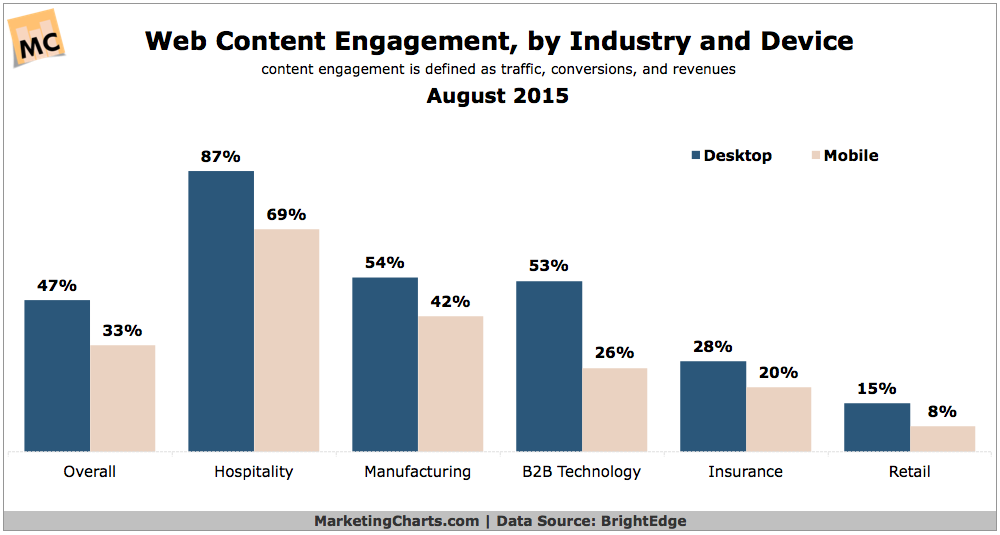
Consumers engage with 20% of B2C content on average, though average engagement with B2B content is higher (50%).
Read MoreAlcohol Preferences By Income & Education, July 2015 [CHART]
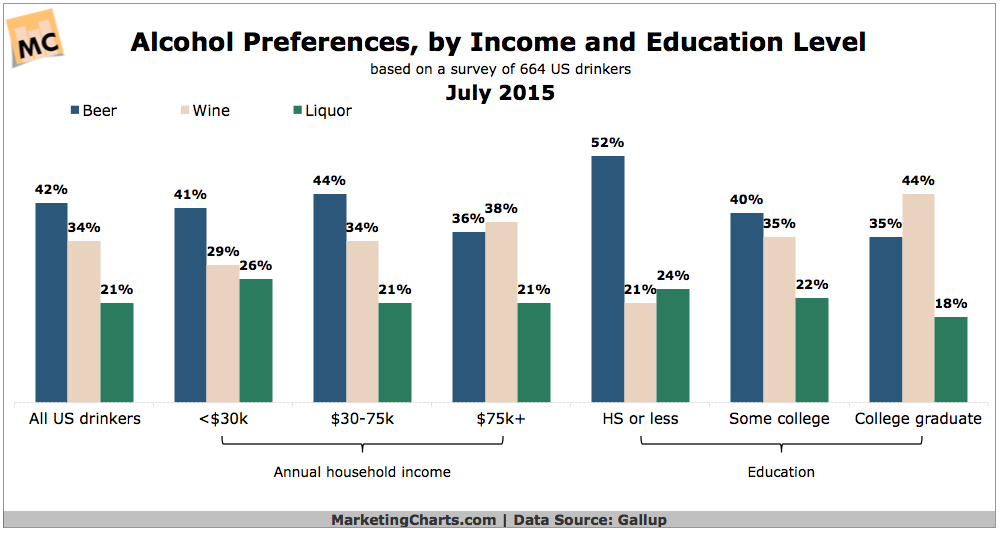
Self-reported alcoholic consumption is far higher among Americans from high-income households than lower-income households.
Read MoreTop Reasons People Don't Watch Mobile TV, July 2015 [CHART]
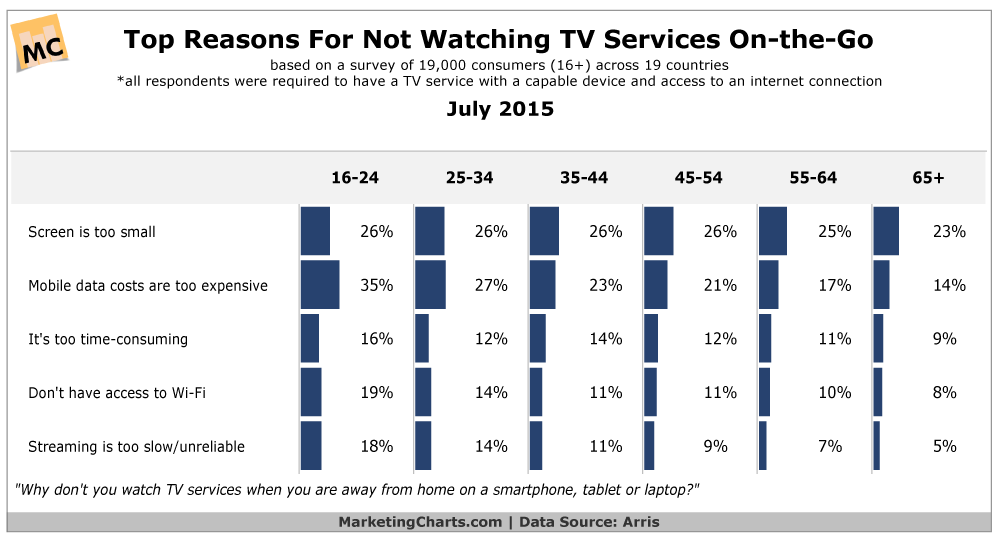
Mobile TV – defined as watching TV services while away from home on a smartphone, tablet or laptop – is growing in frequency.
Read MoreMost Popular Types Of Gaming-Related Video Content, May 2015 [CHART]
The gaming video content audience would total 486 million worldwide this year—and soar to 790 million by 2017.
Read MoreConsumer Attitudes Toward Customer Service, August 2015 [CHART]
Nearly nine in 10 internet users worldwide believe that good service makes them feel more positive about brands.
Read MoreAverage Numbers Of Apps Used Daily, August 2015 [CHART]
Smartphone users typically have a plethora of apps installed on their devices, but use only a select few daily.
Read MoreInfluencer Engagement Challenges, May 2015 [CHART]
Identifying the right influencers was the biggest challenge when rolling out an influencer engagement strategy, cited by 75% of marketers.
Read MoreTop Influencer Marketing Tactics, May 2015 [CHART]
84% of marketing and communications professionals worldwide expected to launch at least one campaign involving an influencer in the next 12 months.
Read MoreCustomer Data B2B Marketers Use For Mobile Insights, May 2015 [CHART]
Though they’re trying to dig themselves out of the hole, B2B marketers continue to miss the mobile mark.
Read MoreUS Department Store Sales, 2004-2014 [CHART]
Department stores are having to adjust their business strategies for the digital age.
Read More