Consumer Behavior
Daily Time Spent On Facebook By Device, 2013-2018 [CHART]
This year, Americans will spend more than half of their social networking time on Facebook.
Read MoreHow Americans Celebrate Independence Day [INFOGRAPHIC]
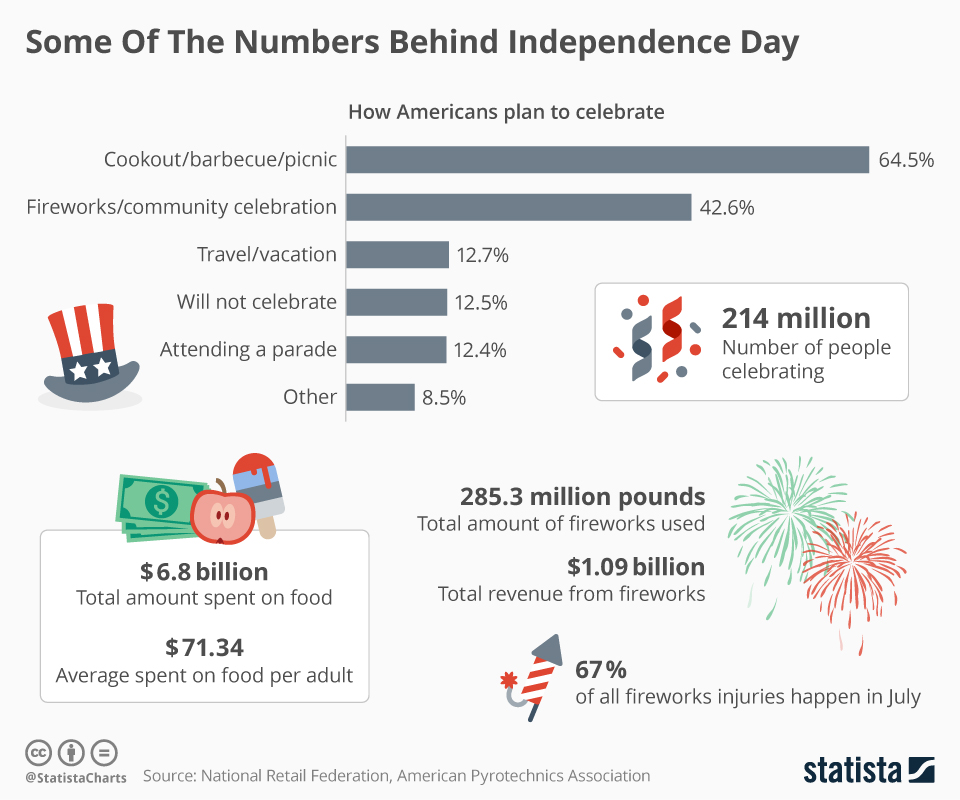
This infographic illustrates how Americans celebrate Independence Day, from eating to travel to entertainment.
Read MoreDesktop vs Mobile Email Click-To-Open Rates [CHART]
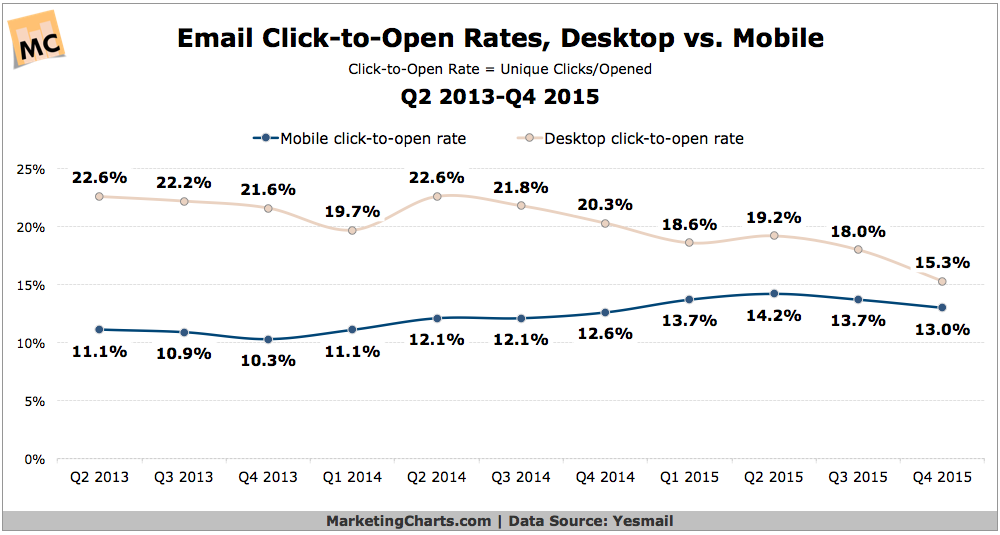
Email click-to-open rates on mobile devices are continuing to close the gap with desktop rates.
Read MoreTop Benefits Of Live Video-Streaming Events [CHART]
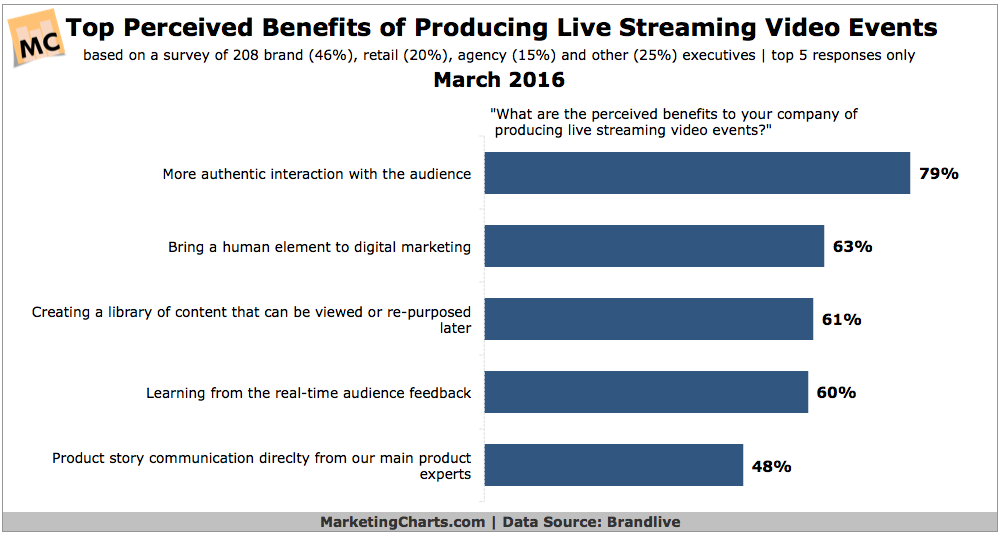
Communication and authenticity appear to be at the heart of live streaming video’s potential benefits to companies.
Read MoreMost Important Factors For B2B Marketers' Future Efforts [CHART]
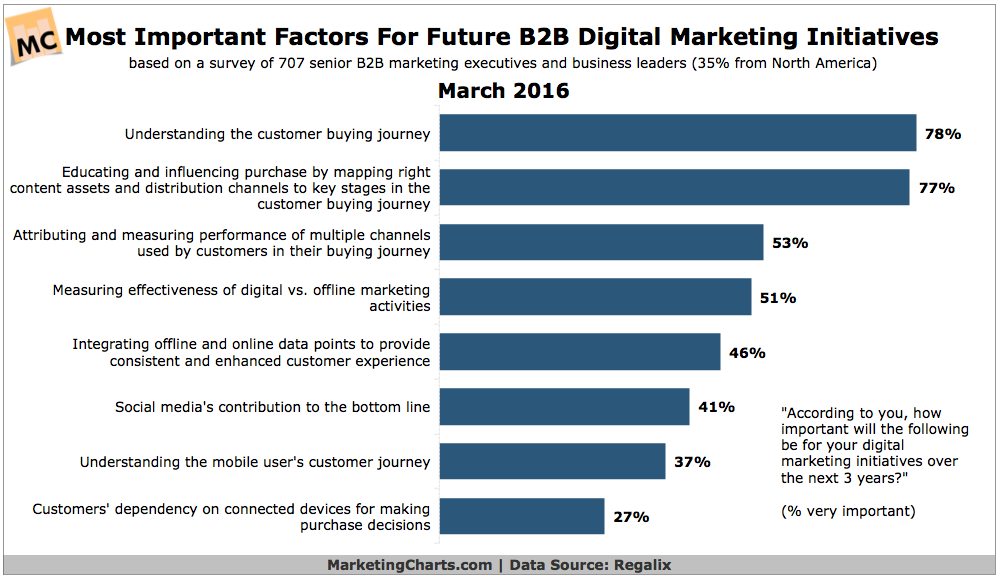
While the delivery of quality leads is marketers’ top objective, measuring and proving ROI is the biggest digital marketing challenge.
Read MoreKeyword Research [INFOGRAPHIC]
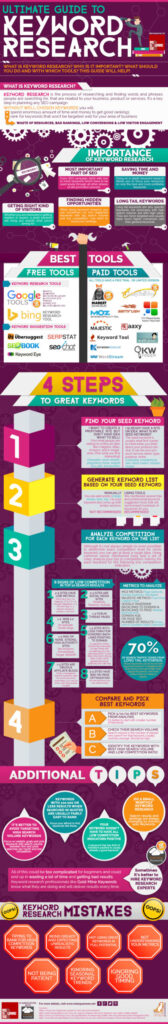
This infographic illustrates the complex practice that is keyword research and search engine optimization.
Read MoreRadio Listeners' Habits By Generation & Ethnicity [CHART]
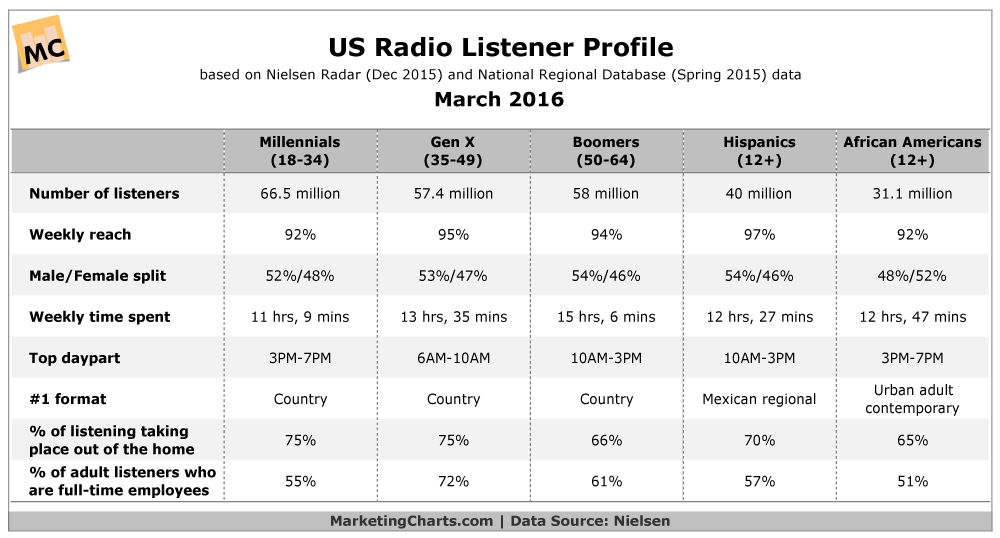
With 93% of US adults listening to radio on a weekly basis, radio is the leading reach platform.
Read MoreVideo Marketing Statistics [INFOGRAPHIC]
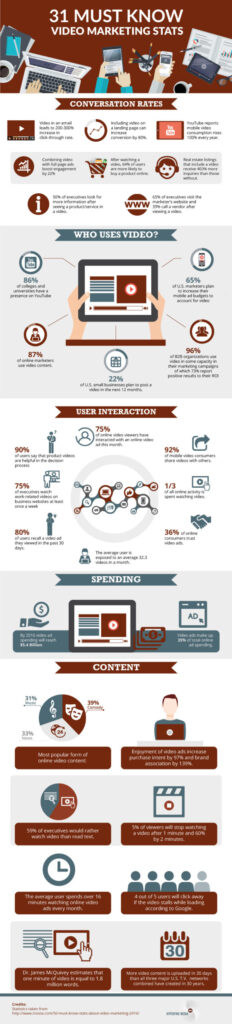
Including a video in an email increases the click-through rate by 200-300 percent. This statistic and 30 more are included in this infographic from Hyperfine Media that illustrates the many ways video can be used for marketing.
Read MoreGoogle AdWords Benchmark Metrics By Industry [CHART]
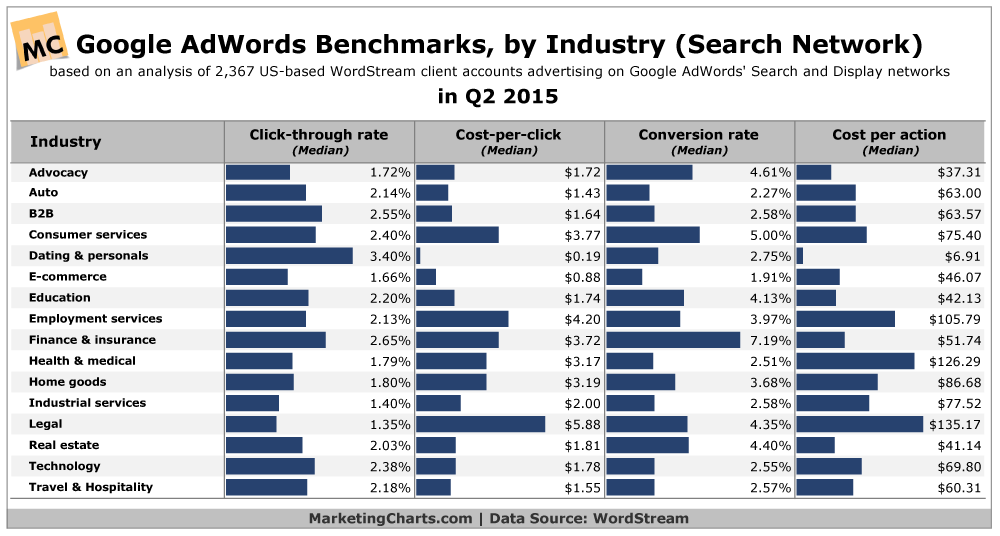
The median click-through rate (CTR) in AdWords across industries is 1.91% on the search network.
Read MoreConsumers' In-Store Mobile Activities [CHART]

Mobile devices and other digital technologies continue to have a growing impact on retail, including in-store shopping.
Read More