Consumer Behavior
Top New App Discovery Methods [CHART]
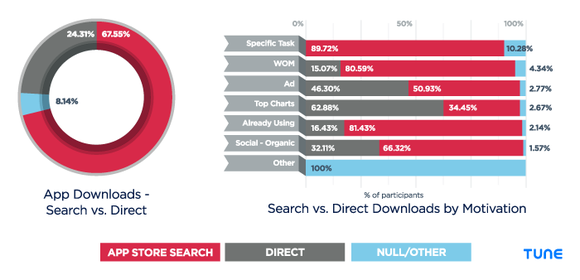
App store search accounts for more than 67% of actual new app discovery.
Read MoreAverage Daily Video Consumption By Device [CHART]
Even in a category as robust as digital video, though, growth has slowed and is expected to slow even more.
Read More5 Most Popular Wearable Devices [CHART]
This year eMarketer estimates wearables usage will grow by roughly 60%, to reach nearly 64 million people.
Read MoreAverage Daily Time Spent With Media, 2012-2018 [TABLE]
Thanks to media multitasking, US adults will squeeze an average of 12 hours, 5 minutes per day of media usage into their waking hours this year—nearly an hour more than the average in 2011.
Read MoreHow People Discover Small Businesses [CHART]
More than one-third of US internet users said they first find out about small businesses when researching online.
Read MoreFacebook Post Reaction Share By Type [CHART]
The lion’s share (97.0% ) of Facebook post reactions consist of Likes.
Read MoreMobile Commerce [INFOGRAPHIC]

This infographic illustrates the mCommerce market, from rising regions, to average order value, to mobile coupon use and payments.
Read MoreSimultaneous Internet & TV Users, 2014-2018 [TABLE]
This year, 182.9 million Americans will use the internet while watching TV at least once a month.
Read MoreAttitudes Toward Political TV & Online Ads [CHART]
The presidential campaigns have had the most variation in ads served.
Read MoreTypes Of Online Harassment [INFOGRAPHIC]
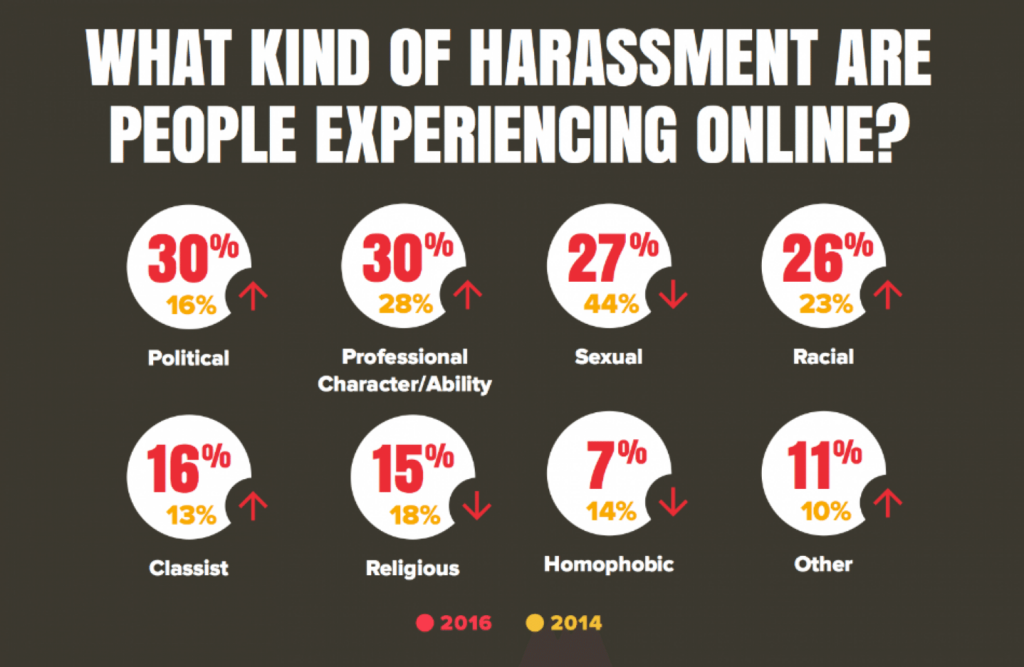
95 percent of all Americans consider incivility a problem. Seventy percent consider it a crisis, which is up from 65 percent in 2014.
Read More