Consumer Behavior
Average Minutes Visitors Spent On News Sites, Mobile vs Desktop [CHART]
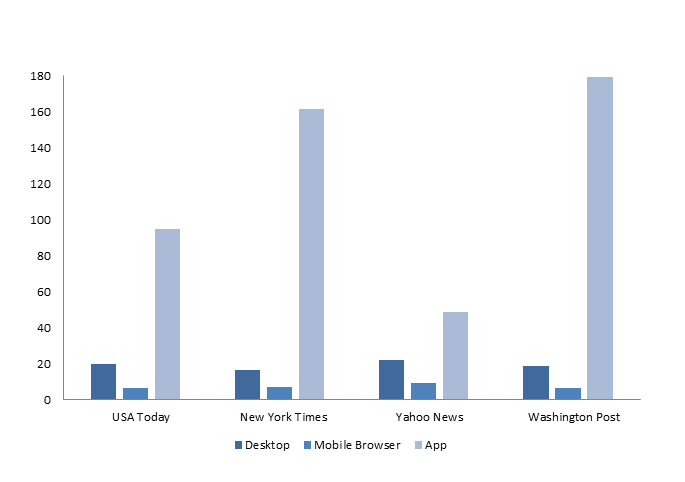
By 2020, two-thirds of all online activity is expected to take place on mobile devices.
Read MorePublic Relations Transformation [INFOGRAPHIC]
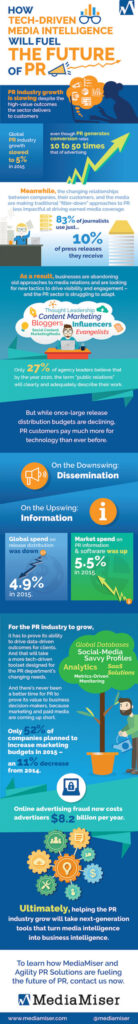
This infographic from MediaMiser highlights what the future of public relations will look like as technology transforms the industry.
Read MoreTop Amazon Search Engine Ranking Factors [CHART]
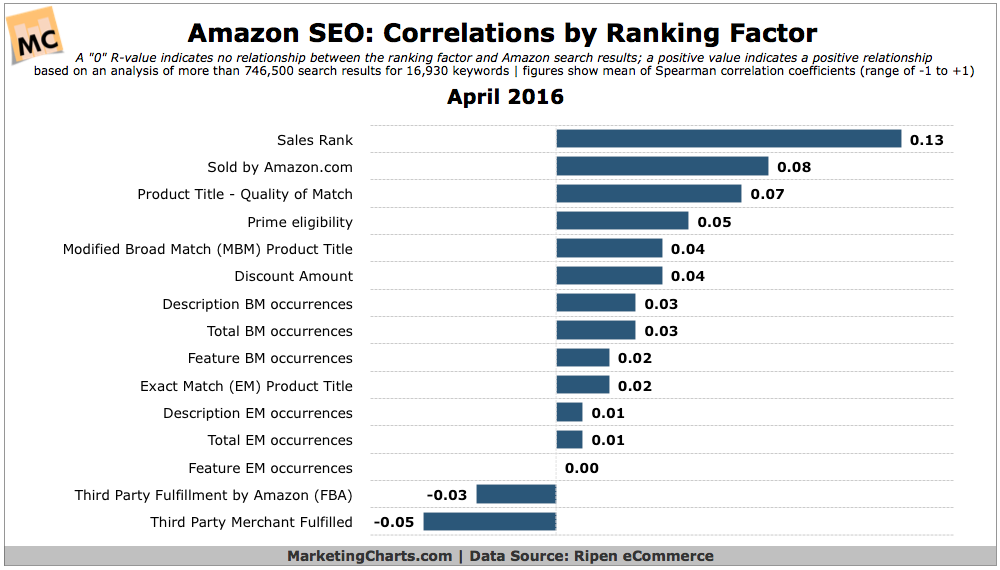
While no single factor has a very strong correlation with search rankings, Amazon’s sales rank has the highest correlation with search success on the platform.
Read MoreTime Spent Online By Content Type Or Channel [CHART]
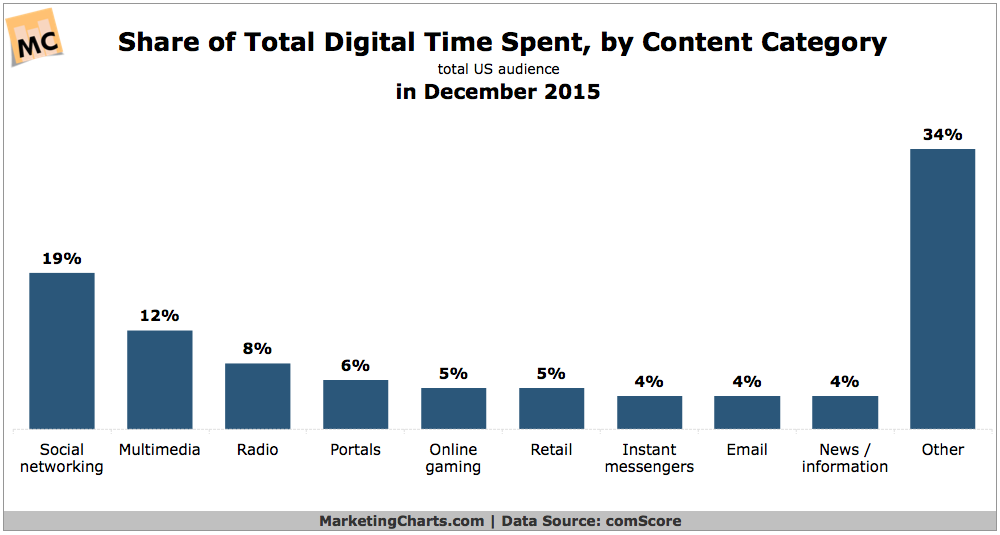
Social networking accounts for almost 1 in every 5 minutes spent online, according to a recent study from comScore.
Read MoreMost Popular Mobile App Types [CHART]
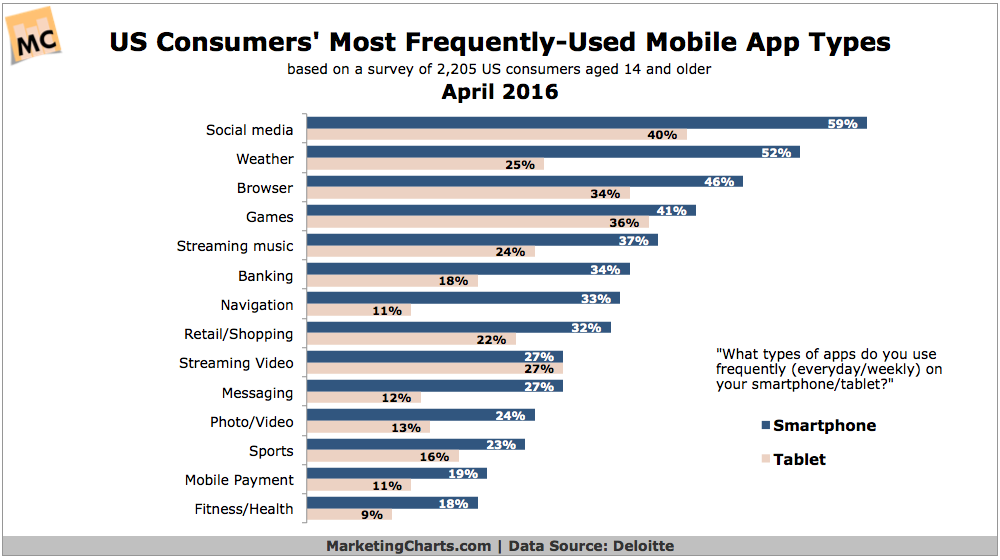
Consumers aged 14 and older access apps more frequently on smartphones than tablets, with social media the top app type on both devices.
Read MoreMost Effective Types Of Email Campaigns [CHART]
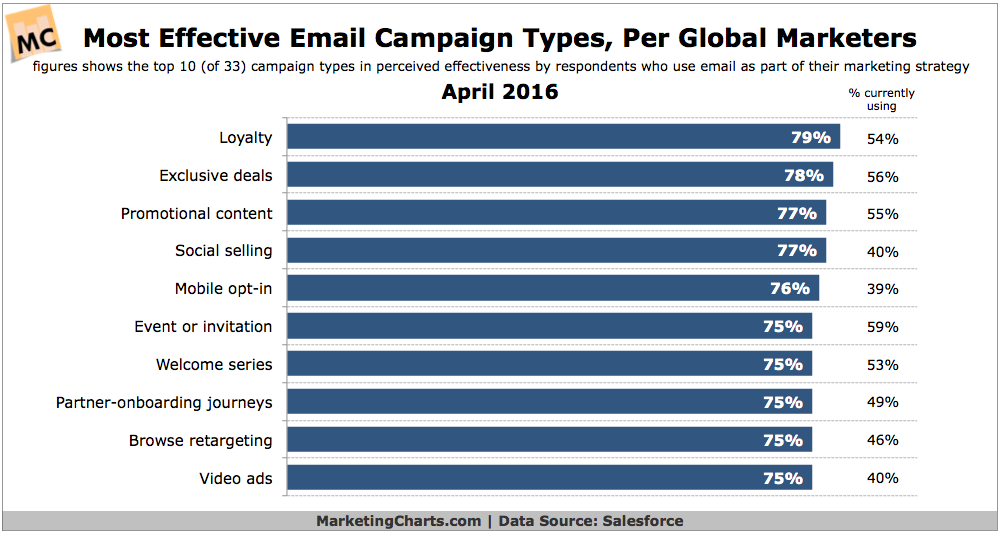
The most commonly used email campaign types aren’t always the most effective.
Read MoreUS Religious Affiliation By Age [CHART]
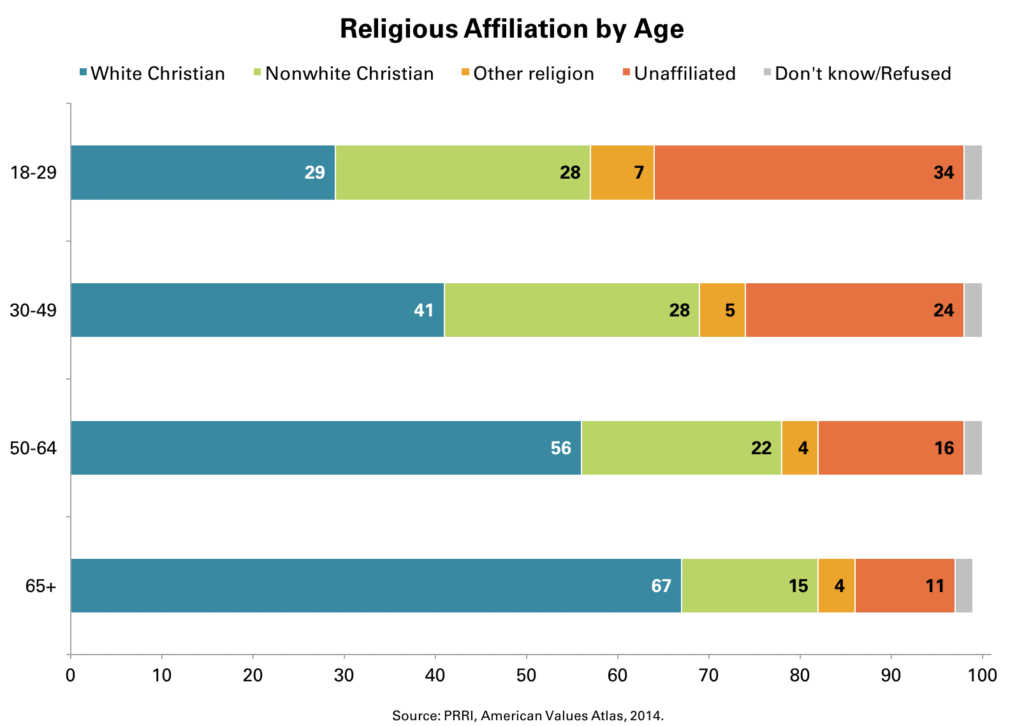
Today, young adults ages 18 to 29 are less than half as likely to be white Christians as seniors age 65 and older.
Read MoreEmail Opens By Device, 2011-2016 [CHART]
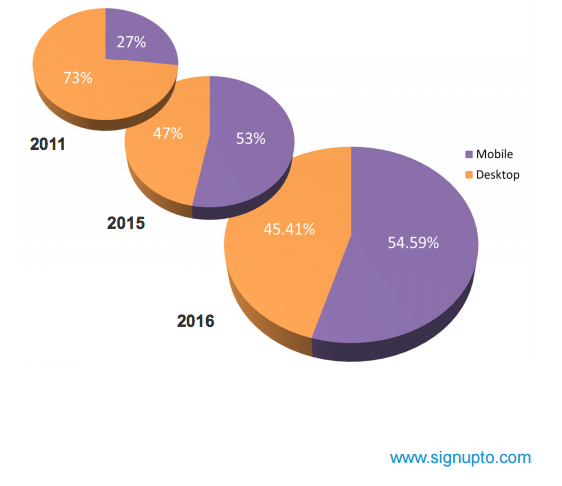
Research from Econsultancy’s 2016 email marketing benchmarks report demonstrates that people more frequently turning to their mobile devices to check email, growing from 27% in 2011 to 55% in 2016.
Read MoreUS Mothers' Average Daily Facebook Use, 2012-2016 [CHART]
US mothers are checking Facebook more times each day than they did in prior years.
Read MoreSnapchat Growth, 2014-2020 [CHART]

In the battle among the social networks to attract new users, 2016 will be a banner year for Snapchat.
Read More