Consumer Behavior
How People Find News About Presidential Candidates [CHART]
Much of the referral traffic to news articles about US presidential candidates is internal.
Read MoreWhat Millennial Women Want [INFOGRAPHIC]
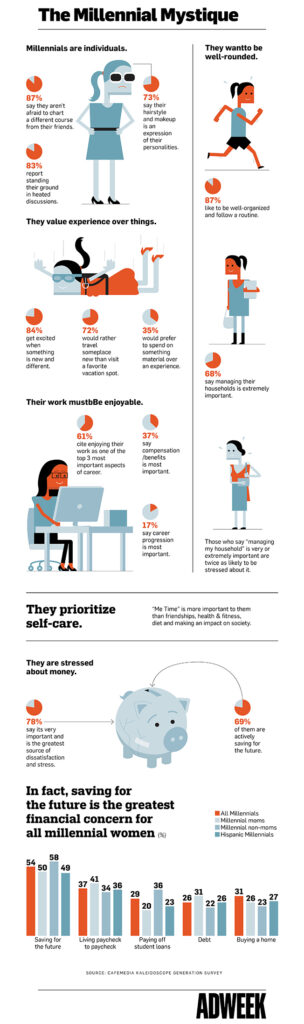
This infographic is based on research from CafeMedia that takes a deeper look at what the segment values most when it comes to work, money, and experiences.
Read MorePodcast Abandonment Rates [CHART]
A quarter of US podcast listeners abandoned podcasts that ran 45 to 60 minutes, though a lower 15% of respondents abandoned podcasts longer than 1 hour.
Read MoreAmerican's Trust In Mass Media [CHART]
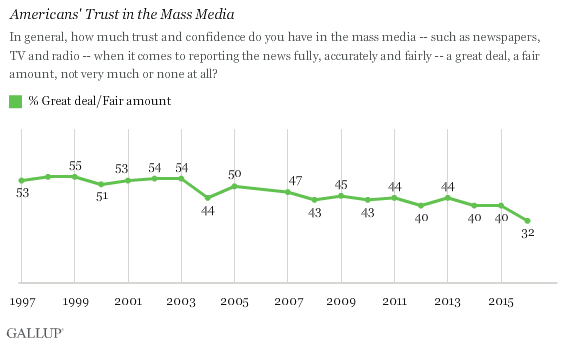
Americans’ trust and confidence in the mass media ‘to report the news fully, accurately and fairly’ has dropped to its lowest level in Gallup polling history.
Read MoreMultiscreen Behavior [PODCAST]
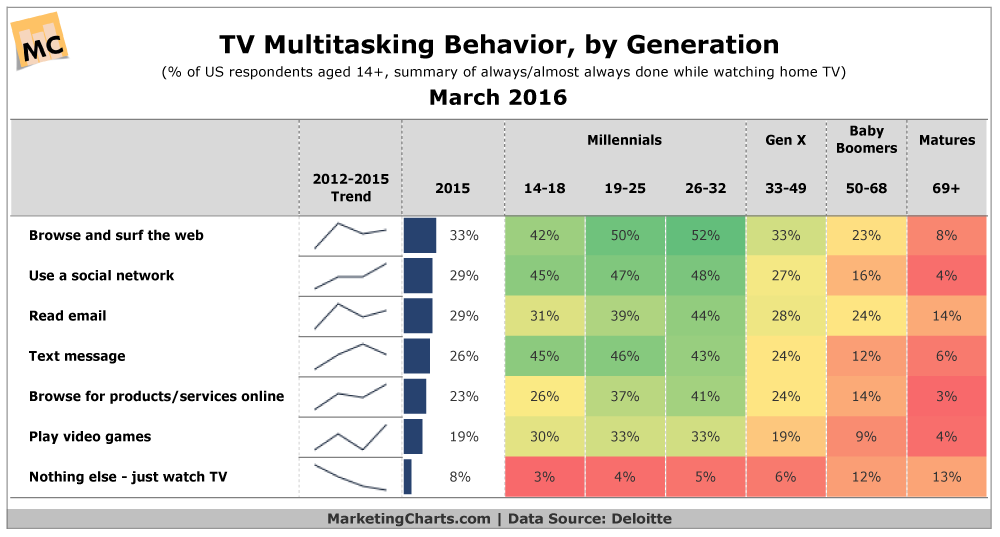
A podcast about multiscreen behavior and 10 charts about multitainment.
Read MorePodcast Listening Frequency [CHART]

Most internet users are familiar with podcasts, but have either not listened to them within the past six months or have never listened to them.
Read MoreMobile vs Tablet Travel Bookings [CHART]
The vast majority of mobile hotel bookings were booked via smartphone in Q1 2016.
Read MoreWhy People Listen To Radio [CHART]
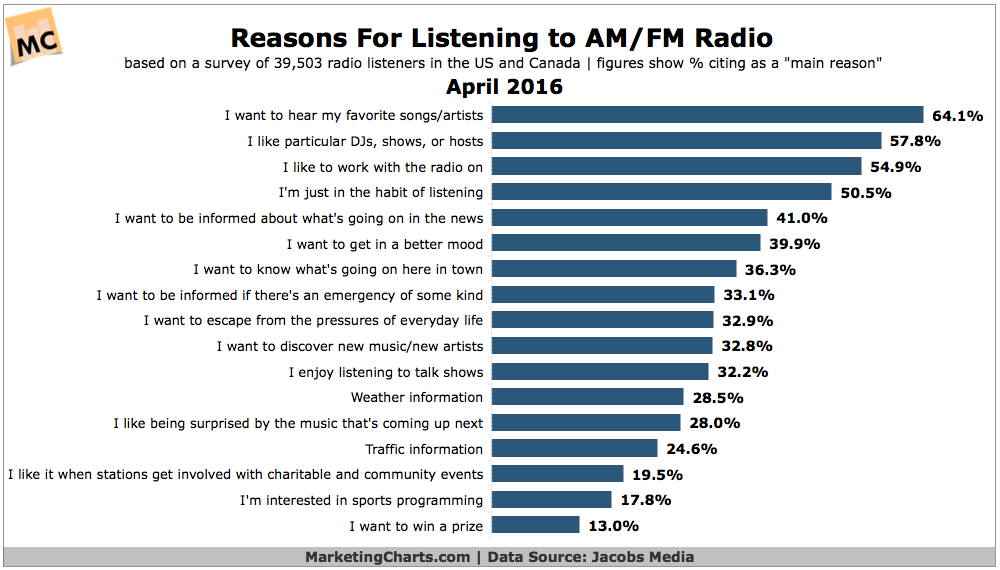
Almost 1 in 5 AM/FM radio listeners report spending more time listening to the radio this year than last, close to twice the proportion of listeners who are tuning in less.
Read MoreCreativity By State [MAP]
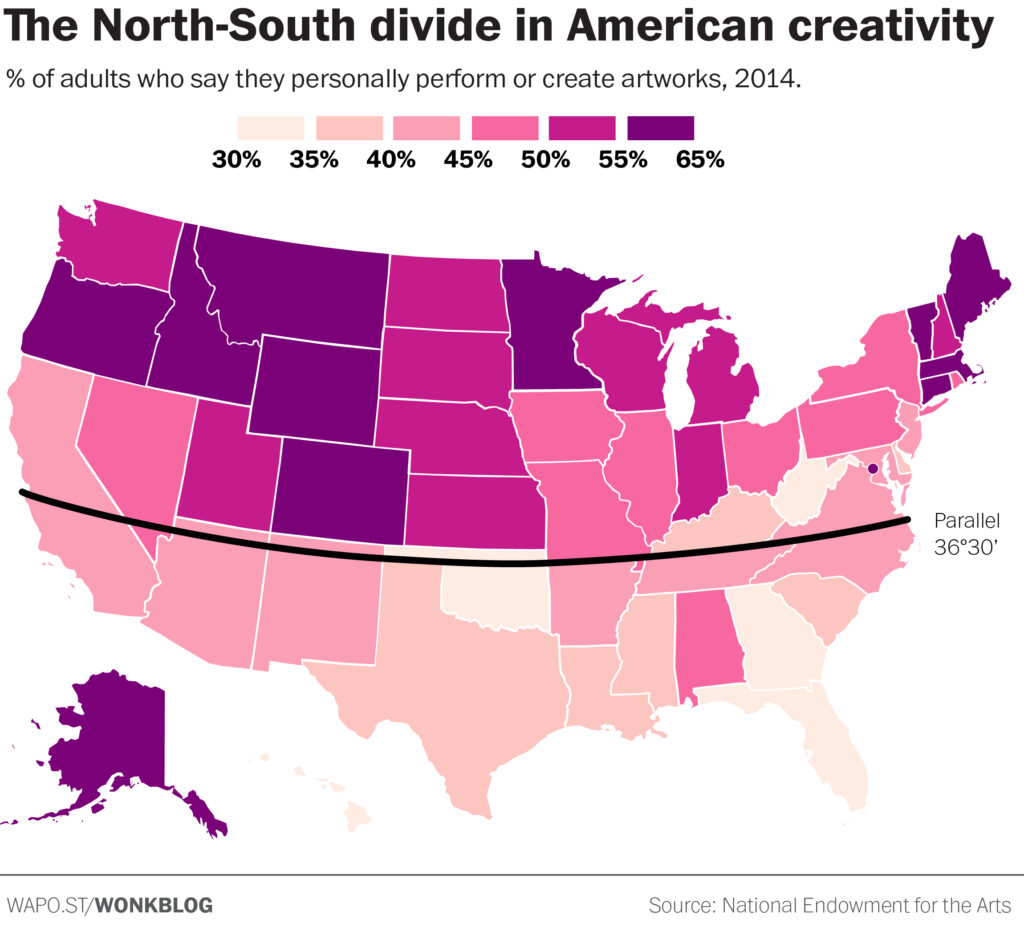
New data recently released by the National Endowment for the Arts suggests that there’s an awful lot of creativity happening far inland from America’s coastal tech and arts hubs.
Read MoreSources Of News, 2012-2016 [CHART]
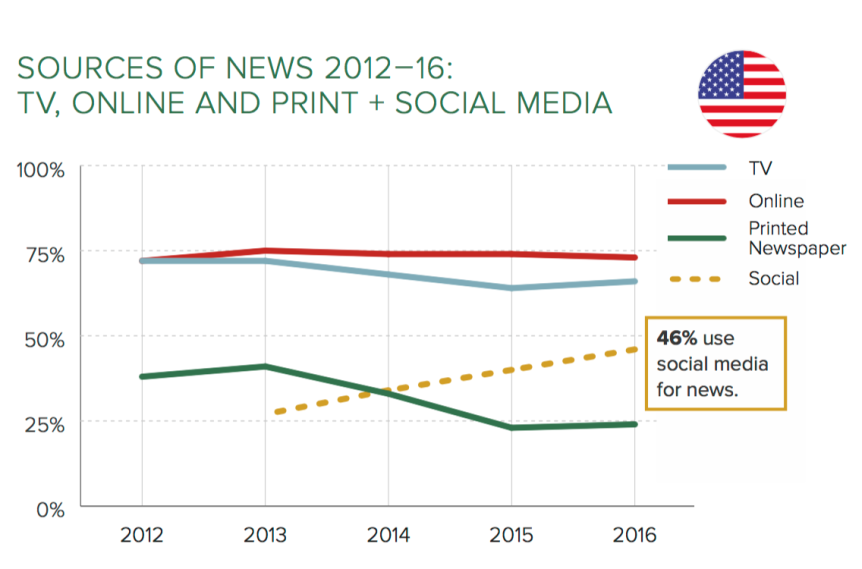
Since 2013, the number of people in the US who say they get their news from social media has doubled—46 percent now use social media for news.
Read More