Consumer Behavior
Weekly Time Spent With Select Media [TABLE]
US consumers spend an average of 35 hours per week watching live and timeshifted television.
Read MoreWhy People Don't Watch News Videos [CHART]
The biggest reason why people did not watch news videos was fundamental to the nature of the medium: It’s just not as quick or convenient as reading.
Read MoreTop Amazon Skills Consumers Have Used [CHART]
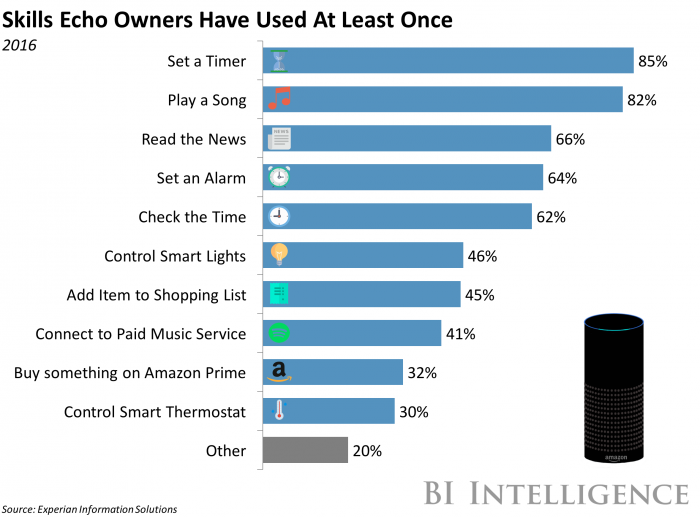
Amazon Skills are Echo capabilities that are offered by Amazon itself or by third-party developers. These are the top 10 Skills customers use.
Read MoreTop Types Of Online News People Consume [CHART]

Traditional, unsexy articles are still the most popular format for news content. Nearly six in 10 internet users said they had read an article in the past week.
Read MoreTop Social Media Marketing Challenges [CHART]
Social marketers in North America still find measuring ROI to be their toughest challenge.
Read MoreDemographics Of Unplugged Vacationers [CHART]
US internet users are equally divided in their intentions to be plugged in or unplugged to the web while on vacation.
Read MoreDevices Millennials Use To Do Political Research [CHART]
Millennials are more likely than their older counterparts to use their tablets, connected TVs—and especially their smartphones—to conduct political research.
Read MoreVideo Subscription Services Market Penetration [CHART]
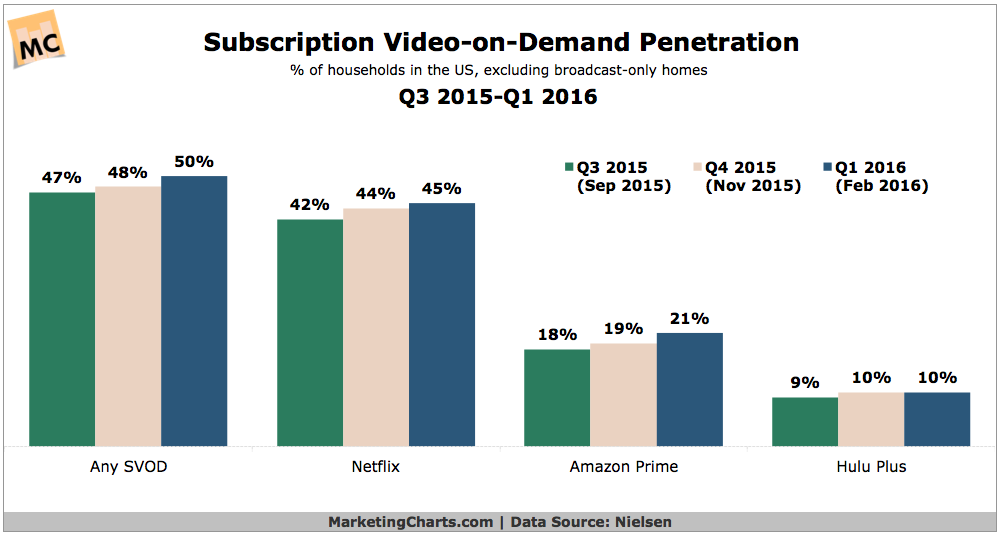
Exactly half of US households had access to a subscription video-on-demand (SVOD) service – such as Hulu, Amazon Prime or Netflix – as of February 2016.
Read MoreMost Important Online Marketing Capabilities [CHART]
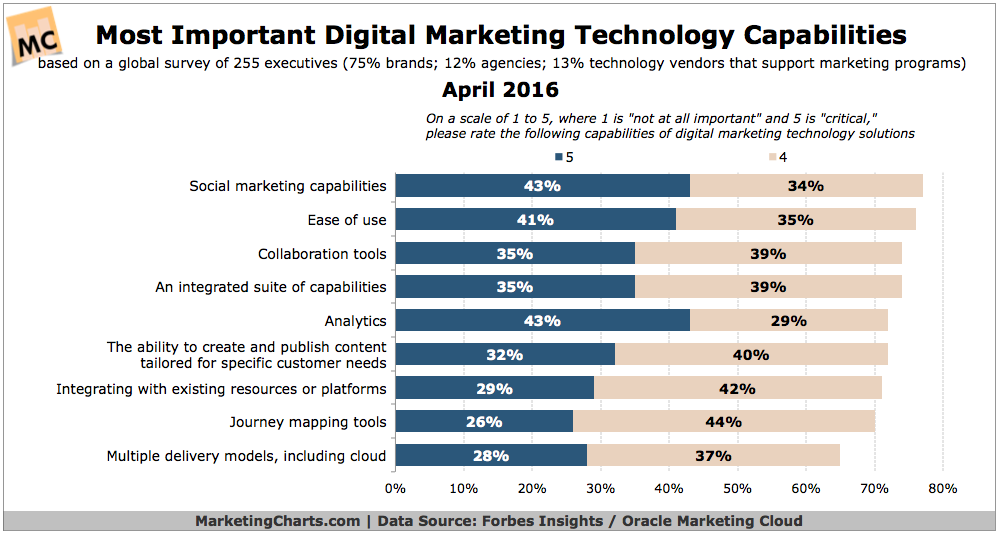
Some 62% of brand and agency representatives around the world are satisfied with how well their current marketing technology is meeting their expectations.
Read MoreInternet Use By Race/Ethnicity, 2014-2020 [TABLE]
Hispanics are often noted for their heavy digital activity, mainly due to high smartphone engagement, but this characteristic isn’t as straightforward as it seems.
Read More